
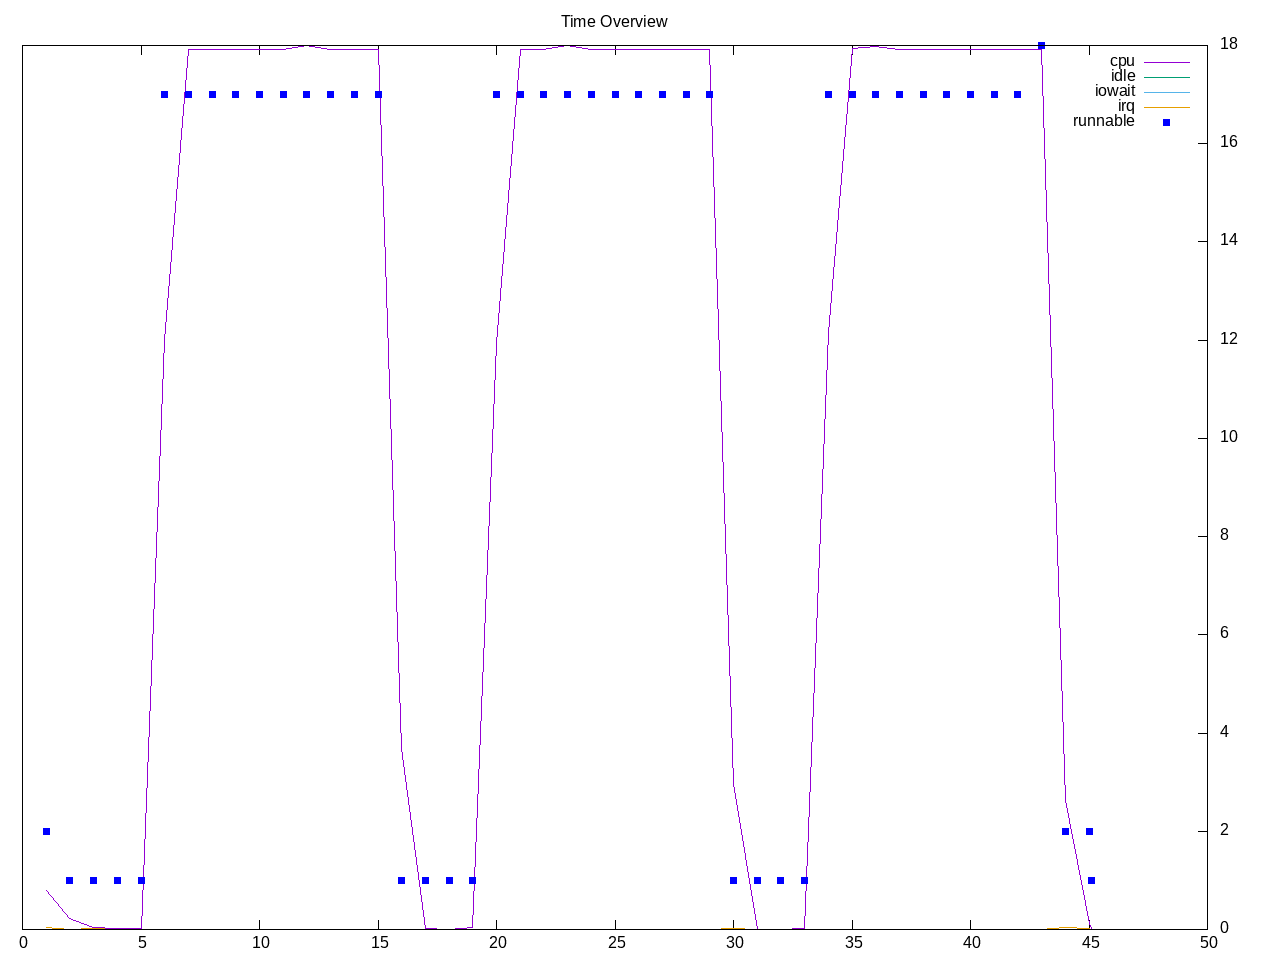
A small C++ code for illumination rendering. Looks to be multi-threaded and quickly running.
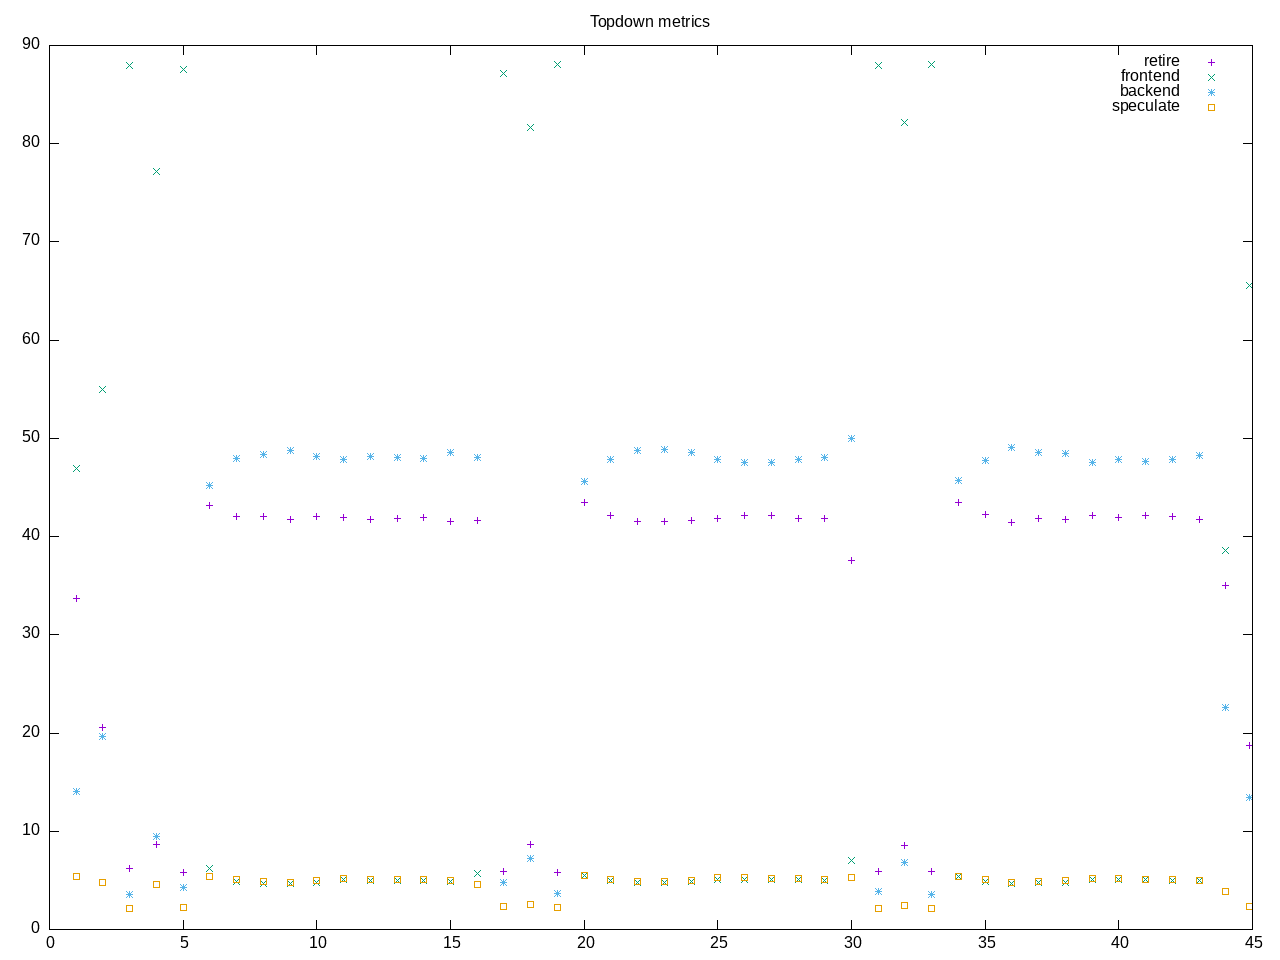
Topdown profile shows backend stalls as largest issue with a moderate retirement rate.
AMD metrics show this is floating point code with small amount of L2 access. Backend stalls are mostly CPU stalls.
elapsed              45.090
on_cpu               0.654          # 10.47 / 16 cores
utime                471.119
stime                0.870
nvcsw                1678           # 25.47%
nivcsw               4911           # 74.53%
inblock              0              # 0.00/sec
onblock              62944          # 1395.95/sec
cpu-clock            472009776505   # 472.010 seconds
task-clock           472014224464   # 472.014 seconds
page faults          163926         # 347.290/sec
context switches     6635           # 14.057/sec
cpu migrations       212            # 0.449/sec
major page faults    12             # 0.025/sec
minor page faults    163914         # 347.265/sec
alignment faults     0              # 0.000/sec
emulation faults     0              # 0.000/sec
branches             290450354693   # 101.312 branches per 1000 inst
branch misses        6280963989     # 2.16% branch miss
conditional          224571701814   # 78.333 conditional branches per 1000 inst
indirect             8558837143     # 2.985 indirect branches per 1000 inst
cpu-cycles           1882296852708  # 2.61 GHz
instructions         2865046175872  # 1.52 IPC
slots                3766723443972  #
retiring             1031193614822  # 27.4% (41.8%)
-- ucode             740624499      #     0.0%
-- fastpath          1030452990323  #    27.4%
frontend             128086560200   #  3.4% ( 5.2%)
-- latency           89260572702    #     2.4%
-- bandwidth         38825987498    #     1.0%
backend              1182909332439  # 31.4% (47.9%)
-- cpu               1030784053449  #    27.4%
-- memory            152125278990   #     4.0%
speculation          124961204508   #  3.3% ( 5.1%)
-- branch mispredict 122654034594   #     3.3%
-- pipeline restart  2307169914     #     0.1%
smt-contention       1299568541868  # 34.5% ( 0.0%)
cpu-cycles           1879246306828  # 2.61 GHz
instructions         2869706329426  # 1.53 IPC
instructions         954570926607   # 0.574 l2 access per 1000 inst
l2 hit from l1       383137104      # 4.29% l2 miss
l2 miss from l1      12700086       #
l2 hit from l2 pf    154085933      #
l3 hit from l2 pf    5453940        #
l3 miss from l2 pf   5369977        #
instructions         955485420525   # 391.055 float per 1000 inst
float 512            77             # 0.000 AVX-512 per 1000 inst
float 256            586            # 0.000 AVX-256 per 1000 inst
float 128            373647513792   # 391.055 AVX-128 per 1000 inst
float MMX            0              # 0.000 MMX per 1000 inst
float scalar         0              # 0.000 scalar per 1000 inst
instructions         2866802424129  #
opcache              402332512660   # 140.342 opcache per 1000 inst
opcache miss         1292555935     #  0.3% opcache miss rate
l1 dTLB miss         31443107       # 0.011 L1 dTLB per 1000 inst
l2 dTLB miss         5381707        # 0.002 L2 dTLB per 1000 inst
instructions         2866800052557  #
icache               2307657177     # 0.805 icache per 1000 inst
icache miss          286395407      # 12.4% icache miss rate
l1 iTLB miss         8608125        # 0.003 L1 iTLB per 1000 inst
l2 iTLB miss         0              # 0.000 L2 iTLB per 1000 inst
tlb flush            16974          # 0.000 TLB flush per 1000 inst
Intel metrics confirm low L2 access and show higher level of branch misprediction
elapsed              46.525
on_cpu               0.673          # 10.77 / 16 cores
utime                500.506
stime                0.384
nvcsw                1211           # 19.40%
nivcsw               5030           # 80.60%
inblock              4656           # 100.08/sec
onblock              51592          # 1108.91/sec
cpu-clock            500904808159   # 500.905 seconds
task-clock           500907949143   # 500.908 seconds
page faults          99508          # 198.655/sec
context switches     6290           # 12.557/sec
cpu migrations       222            # 0.443/sec
major page faults    58             # 0.116/sec
minor page faults    99450          # 198.539/sec
alignment faults     0              # 0.000/sec
emulation faults     0              # 0.000/sec
branches             289123524356   # 101.078 branches per 1000 inst
branch misses        6697550758     # 2.32% branch miss
conditional          289123534756   # 101.078 conditional branches per 1000 inst
indirect             53838970043    # 18.822 indirect branches per 1000 inst
slots                2855244531524  #
retiring             1627251960026  # 57.0% (57.0%) high
-- ucode             35202779377    #     1.2%
-- fastpath          1592049180649  #    55.8%
frontend             521415453265   # 18.3% (18.3%)
-- latency           452095257232   #    15.8%
-- bandwidth         69320196033    #     2.4%
backend              297810108968   # 10.4% (10.4%) low
-- cpu               214954934707   #     7.5%
-- memory            82855174261    #     2.9%
speculation          409638370395   # 14.3% (14.3%) high
-- branch mispredict 409107060915   #    14.3%
-- pipeline restart  531309480      #     0.0%
smt-contention       0              #  0.0% ( 0.0%)
cpu-cycles           3296409027952  # 2.19 GHz
instructions         5741847939829  # 1.74 IPC
l2 access            306096009      # 0.094 l2 access per 1000 inst
l2 miss              67249322       # 21.97% l2 miss
cpu-cycles           1860051893950  # 16.4% memory latency
load stalls          304362400662   # 16.3% l1 bound
l1 miss              798391811      #  0.0% l2 bound
l2 miss              362458552      #  0.0% l3 bound
l3 miss              166527645      #  0.0% dram bound
store_stalls         143931493      #  0.0% store bound
Process profile shows the smallpt-rendere process is primary process
384 processes
	 48 smallpt-rendere       7485.92     2.08
	 68 clinfo                  15.87     6.24
	 38 vulkaninfo               1.15     1.14
	  4 vulkani:disk$0           0.12     0.12
	  6 php                      0.06     0.06
	  2 llvmpipe-0               0.06     0.06
	  2 llvmpipe-1               0.06     0.06
	  2 llvmpipe-10              0.06     0.06
	  2 llvmpipe-11              0.06     0.06
	  2 llvmpipe-12              0.06     0.06
	  2 llvmpipe-13              0.06     0.06
	  2 llvmpipe-14              0.06     0.06
	  2 llvmpipe-15              0.06     0.06
	  2 llvmpipe-2               0.06     0.06
	  2 llvmpipe-3               0.06     0.06
	  2 llvmpipe-4               0.06     0.06
	  2 llvmpipe-5               0.06     0.06
	  2 llvmpipe-6               0.06     0.06
	  2 llvmpipe-7               0.06     0.06
	  2 llvmpipe-8               0.06     0.06
	  2 llvmpipe-9               0.06     0.06
	  6 clang                    0.05     0.07
	  3 rocminfo                 0.00     0.03
	  1 lspci                    0.00     0.02
	 84 sh                       0.00     0.00
	 13 gcc                      0.00     0.00
	 11 gsettings                0.00     0.00
	  8 stat                     0.00     0.00
	  8 systemd-detect-          0.00     0.00
	  6 llvm-link                0.00     0.00
	  5 glxinfo                  0.00     0.00
	  5 phoronix-test-s          0.00     0.00
	  3 gmain                    0.00     0.00
	  3 smallpt                  0.00     0.00
	  2 cc                       0.00     0.00
	  2 dconf worker             0.00     0.00
	  2 grep                     0.00     0.00
	  2 lscpu                    0.00     0.00
	  2 setterm                  0.00     0.00
	  2 uname                    0.00     0.00
	  2 which                    0.00     0.00
	  1 date                     0.00     0.00
	  1 dirname                  0.00     0.00
	  1 dmesg                    0.00     0.00
	  1 dmidecode                0.00     0.00
	  1 ifconfig                 0.00     0.00
	  1 ip                       0.00     0.00
	  1 lsmod                    0.00     0.00
	  1 mktemp                   0.00     0.00
	  1 ps                       0.00     0.00
	  1 qdbus                    0.00     0.00
	  1 readlink                 0.00     0.00
	  1 realpath                 0.00     0.00
	  1 sed                      0.00     0.00
	  1 sort                     0.00     0.00
	  1 stty                     0.00     0.00
	  1 systemctl                0.00     0.00
	  1 template.sh              0.00     0.00
	  1 wc                       0.00     0.00
0 processes running
47 maximum processes
Process tree shows following pattern for core computation blocks.
      230105) smallpt          cpu=1 start=5.51  finish=15.35
        230106) smallpt-rendere  cpu=11 start=5.51  finish=15.35
          230107) smallpt-rendere  cpu=6 start=5.52  finish=15.35
          230108) smallpt-rendere  cpu=12 start=5.52  finish=15.35
          230109) smallpt-rendere  cpu=8 start=5.52  finish=15.35
          230110) smallpt-rendere  cpu=15 start=5.52  finish=15.35
          230111) smallpt-rendere  cpu=5 start=5.52  finish=15.35
          230112) smallpt-rendere  cpu=2 start=5.52  finish=15.35
          230113) smallpt-rendere  cpu=9 start=5.52  finish=15.35
          230114) smallpt-rendere  cpu=3 start=5.52  finish=15.35
          230115) smallpt-rendere  cpu=13 start=5.52  finish=15.35
          230116) smallpt-rendere  cpu=4 start=5.52  finish=15.35
          230117) smallpt-rendere  cpu=14 start=5.52  finish=15.35
          230118) smallpt-rendere  cpu=7 start=5.52  finish=15.35
          230119) smallpt-rendere  cpu=10 start=5.53  finish=15.35
          230120) smallpt-rendere  cpu=0 start=5.53  finish=15.35
          230121) smallpt-rendere  cpu=1 start=5.53  finish=15.35