
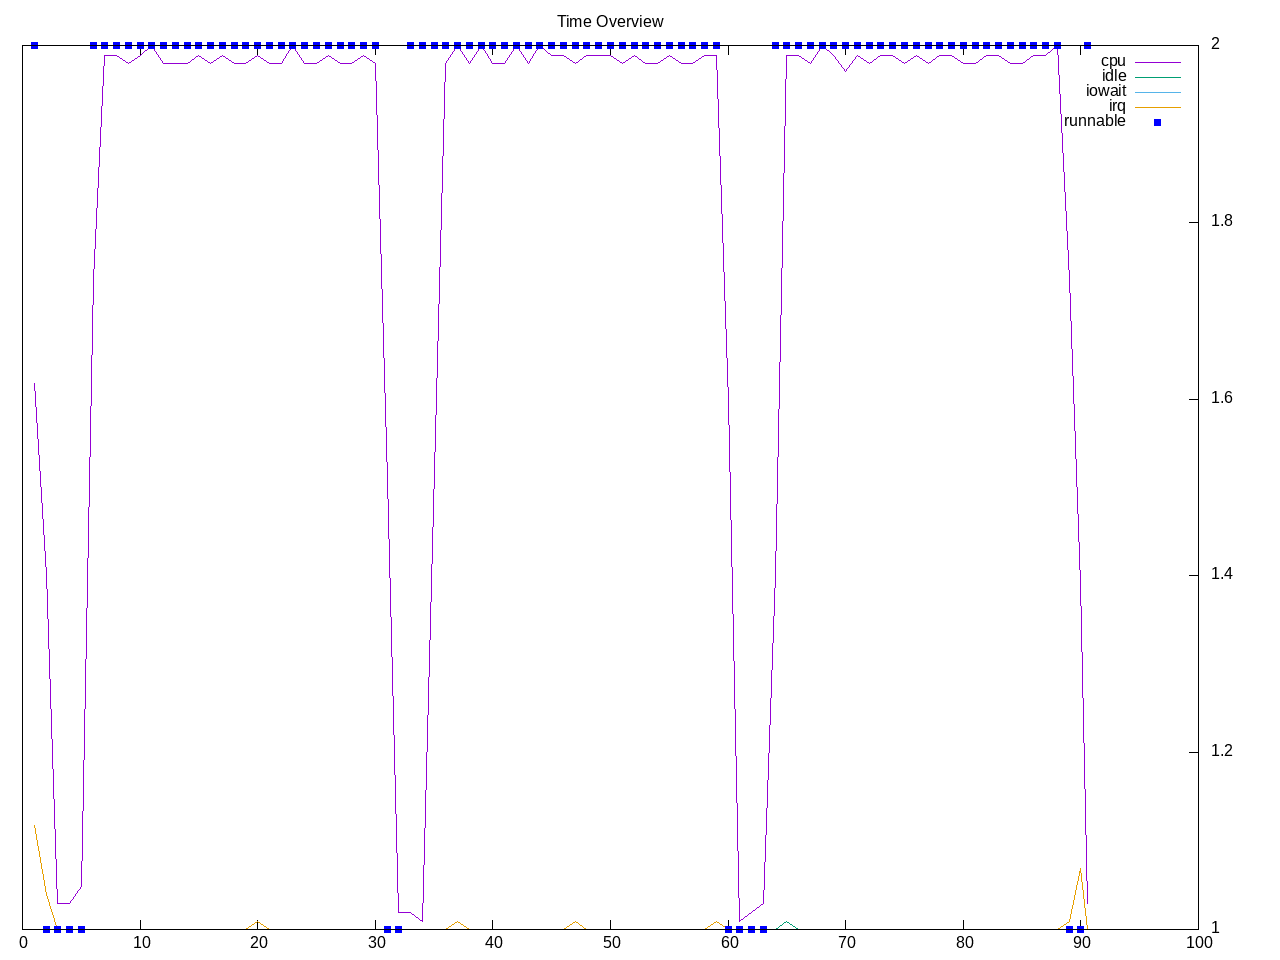
A JPEG compression/decompression benchmark. This reports as a single number of decompression throughput that runs in ~30 seconds. This test looks to be single-threaded.
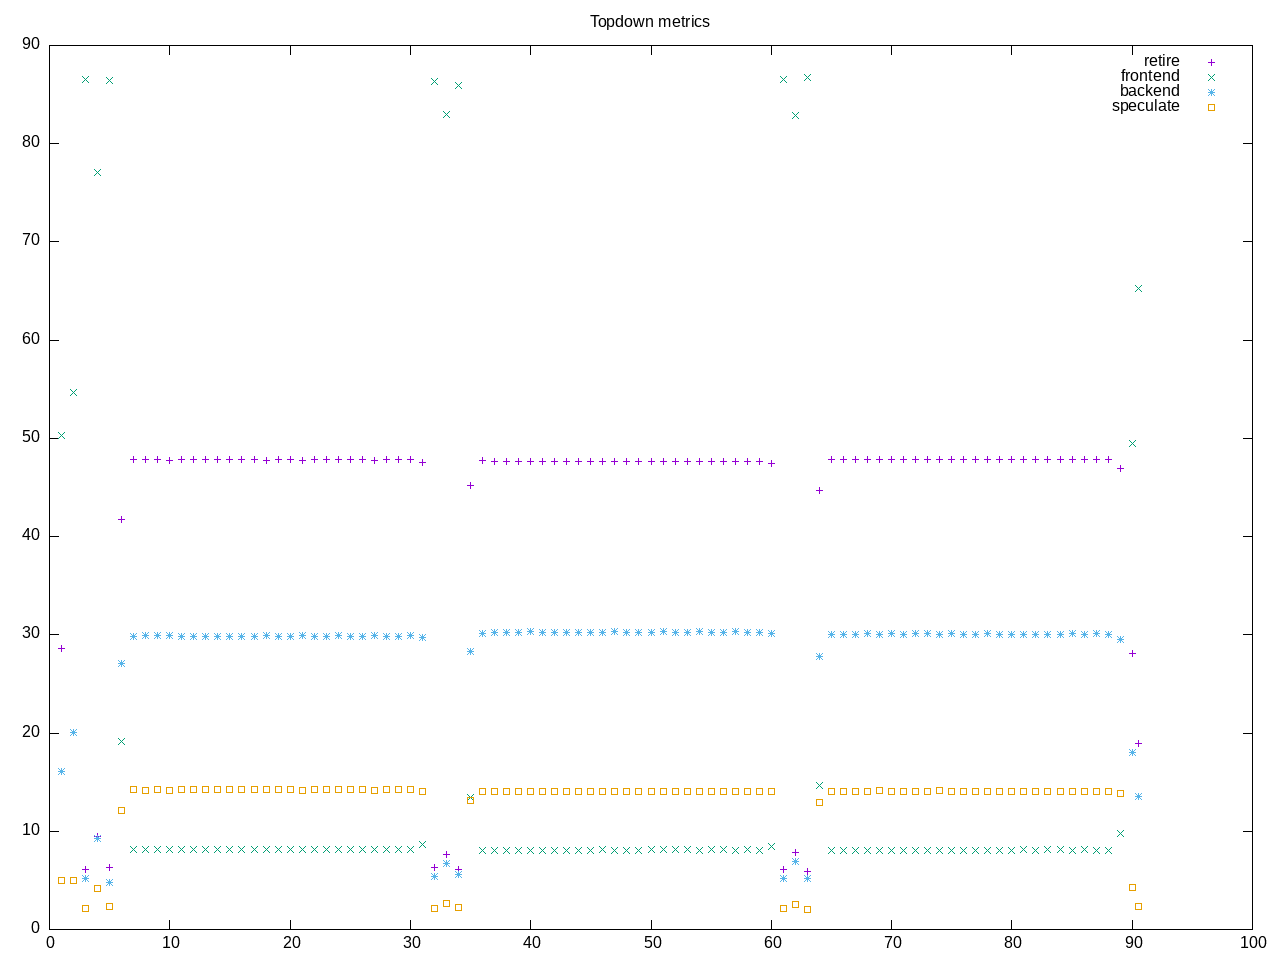
Topdown metrics have a moderately high retirement rate with some backend stalls. There are also higher than average branch mis-predictions.
AMD metrics confirm this runs on one core. There is little floating point code. Only ~90 branches per 1000 instructions but still a 3% branch mis-prediction rate.
elapsed              90.610
on_cpu               0.053          # 0.85 / 16 cores
utime                75.875
stime                0.862
nvcsw                1770           # 76.92%
nivcsw               531            # 23.08%
inblock              0              # 0.00/sec
onblock              12648          # 139.59/sec
cpu-clock            76766383142    # 76.766 seconds
task-clock           76769375887    # 76.769 seconds
page faults          190680         # 2483.803/sec
context switches     2586           # 33.685/sec
cpu migrations       265            # 3.452/sec
major page faults    2              # 0.026/sec
minor page faults    190678         # 2483.777/sec
alignment faults     0              # 0.000/sec
emulation faults     0              # 0.000/sec
branches             93460735704    # 89.021 branches per 1000 inst
branch misses        3008416876     # 3.22% branch miss
conditional          86580033243    # 82.467 conditional branches per 1000 inst
indirect             1032761588     # 0.984 indirect branches per 1000 inst
cpu-cycles           351394771396   # 0.24 GHz
instructions         1050118967313  # 2.99 IPC
slots                704878734078   #
retiring             334650976850   # 47.5% (47.5%)
-- ucode             70653896       #     0.0%
-- fastpath          334580322954   #    47.5%
frontend             61203322757    #  8.7% ( 8.7%)
-- latency           47074633296    #     6.7%
-- bandwidth         14128689461    #     2.0%
backend              209972253736   # 29.8% (29.8%)
-- cpu               73322992101    #    10.4%
-- memory            136649261635   #    19.4%
speculation          98809174500    # 14.0% (14.0%) high
-- branch mispredict 98683006907    #    14.0%
-- pipeline restart  126167593      #     0.0%
smt-contention       242650350      #  0.0% ( 0.0%)
cpu-cycles           351908233616   # 0.24 GHz
instructions         1046603000920  # 2.97 IPC
instructions         349033167457   # 5.604 l2 access per 1000 inst
l2 hit from l1       1278995515     # 15.64% l2 miss
l2 miss from l1      34123235       #
l2 hit from l2 pf    405098336      #
l3 hit from l2 pf    24702013       #
l3 miss from l2 pf   247064594      #
instructions         349083448347   # 9.194 float per 1000 inst
float 512            80             # 0.000 AVX-512 per 1000 inst
float 256            674            # 0.000 AVX-256 per 1000 inst
float 128            3209459937     # 9.194 AVX-128 per 1000 inst
float MMX            0              # 0.000 MMX per 1000 inst
float scalar         2              # 0.000 scalar per 1000 inst
instructions         1047363530640  #
opcache              175933785516   # 167.978 opcache per 1000 inst
opcache miss         686228671      #  0.4% opcache miss rate
l1 dTLB miss         39189917       # 0.037 L1 dTLB per 1000 inst
l2 dTLB miss         19063155       # 0.018 L2 dTLB per 1000 inst
instructions         1053405213672  #
icache               1421453866     # 1.349 icache per 1000 inst
icache miss          141139750      #  9.9% icache miss rate
l1 iTLB miss         904104         # 0.001 L1 iTLB per 1000 inst
l2 iTLB miss         0              # 0.000 L2 iTLB per 1000 inst
tlb flush            20701          # 0.000 TLB flush per 1000 inst
Intel metrics also show high branch mis-prediction.
elapsed              90.210
on_cpu               0.053          # 0.85 / 16 cores
utime                75.892
stime                0.420
nvcsw                1477           # 78.02%
nivcsw               416            # 21.98%
inblock              24             # 0.27/sec
onblock              1368           # 15.16/sec
cpu-clock            76324507443    # 76.325 seconds
task-clock           76326910376    # 76.327 seconds
page faults          147820         # 1936.670/sec
context switches     2174           # 28.483/sec
cpu migrations       189            # 2.476/sec
major page faults    0              # 0.000/sec
minor page faults    147820         # 1936.670/sec
alignment faults     0              # 0.000/sec
emulation faults     0              # 0.000/sec
branches             69225074899    # 88.832 branches per 1000 inst
branch misses        2127831269     # 3.07% branch miss
conditional          69225084755    # 88.832 conditional branches per 1000 inst
indirect             767701560      # 0.985 indirect branches per 1000 inst
slots                1729062295772  #
retiring             757616713936   # 43.8% (43.8%)
-- ucode             49787088500    #     2.9%
-- fastpath          707829625436   #    40.9%
frontend             84350730758    #  4.9% ( 4.9%) low
-- latency           44595436672    #     2.6%
-- bandwidth         39755294086    #     2.3%
backend              533296092080   # 30.8% (30.8%)
-- cpu               459462063373   #    26.6%
-- memory            73834028707    #     4.3%
speculation          362832053071   # 21.0% (21.0%) high
-- branch mispredict 362770144112   #    21.0%
-- pipeline restart  61908959       #     0.0%
smt-contention       0              #  0.0% ( 0.0%)
cpu-cycles           288157381870   # 0.20 GHz
instructions         779238641030   # 2.70 IPC
l2 access            3709656569     # 4.761 l2 access per 1000 inst
l2 miss              1548267647     # 41.74% l2 miss
cpu-cycles           288650034648   #  8.9% memory latency
load stalls          25393223674    #  8.2% l1 bound
l1 miss              1812571872     #  0.5% l2 bound
l2 miss              500138858      #  0.1% l3 bound
l3 miss              350603520      #  0.1% dram bound
store_stalls         325944469      #  0.1% store bound
Process overview shows everything as single invocations of tjbench
322 processes
	  6 tjbench                 75.07     0.14
	 36 clinfo                   3.94     2.08
	 38 vulkaninfo               1.33     1.15
	  4 vulkani:disk$0           0.14     0.13
	  6 glxinfo:gdrv0            0.09     0.07
	  6 glxinfo:gl0              0.09     0.07
	  6 php                      0.08     0.05
	  2 llvmpipe-0               0.07     0.07
	  2 llvmpipe-1               0.07     0.07
	  2 llvmpipe-10              0.07     0.07
	  2 llvmpipe-11              0.07     0.07
	  2 llvmpipe-12              0.07     0.07
	  2 llvmpipe-13              0.07     0.07
	  2 llvmpipe-14              0.07     0.07
	  2 llvmpipe-15              0.07     0.07
	  2 llvmpipe-2               0.07     0.07
	  2 llvmpipe-3               0.07     0.07
	  2 llvmpipe-4               0.07     0.07
	  2 llvmpipe-5               0.07     0.07
	  2 llvmpipe-6               0.07     0.07
	  2 llvmpipe-7               0.07     0.07
	  2 llvmpipe-8               0.07     0.07
	  2 llvmpipe-9               0.07     0.07
	  6 clang                    0.06     0.06
	  2 glxinfo                  0.05     0.04
	  2 glxinfo:cs0              0.05     0.04
	  2 glxinfo:disk$0           0.05     0.04
	  2 glxinfo:sh0              0.05     0.04
	  2 glxinfo:shlo0            0.05     0.04
	  3 rocminfo                 0.00     0.03
	  1 lspci                    0.00     0.02
	 82 sh                       0.00     0.00
	 13 gcc                      0.00     0.00
	 12 gsettings                0.00     0.00
	  8 stat                     0.00     0.00
	  8 systemd-detect-          0.00     0.00
	  6 llvm-link                0.00     0.00
	  5 phoronix-test-s          0.00     0.00
	  3 gmain                    0.00     0.00
	  2 cc                       0.00     0.00
	  2 lscpu                    0.00     0.00
	  2 uname                    0.00     0.00
	  2 which                    0.00     0.00
	  2 xset                     0.00     0.00
	  1 date                     0.00     0.00
	  1 dconf worker             0.00     0.00
	  1 dirname                  0.00     0.00
	  1 dmesg                    0.00     0.00
	  1 dmidecode                0.00     0.00
	  1 grep                     0.00     0.00
	  1 ifconfig                 0.00     0.00
	  1 ip                       0.00     0.00
	  1 lsmod                    0.00     0.00
	  1 mktemp                   0.00     0.00
	  1 ps                       0.00     0.00
	  1 qdbus                    0.00     0.00
	  1 readlink                 0.00     0.00
	  1 realpath                 0.00     0.00
	  1 sed                      0.00     0.00
	  1 sort                     0.00     0.00
	  1 stty                     0.00     0.00
	  1 systemctl                0.00     0.00
	  1 template.sh              0.00     0.00
	  1 wc                       0.00     0.00
	  1 xrandr                   0.00     0.00
0 processes running
47 maximum processes
Very simple computation blocks
      64403) tjbench          cpu=3 start=5.45  finish=30.51
        64404) tjbench          cpu=13 start=5.45  finish=30.51
      64409) tjbench          cpu=0 start=34.51 finish=59.62
        64410) tjbench          cpu=1 start=34.52 finish=59.62
      64412) tjbench          cpu=0 start=63.62 finish=88.71
        64413) tjbench          cpu=1 start=63.62 finish=88.71