
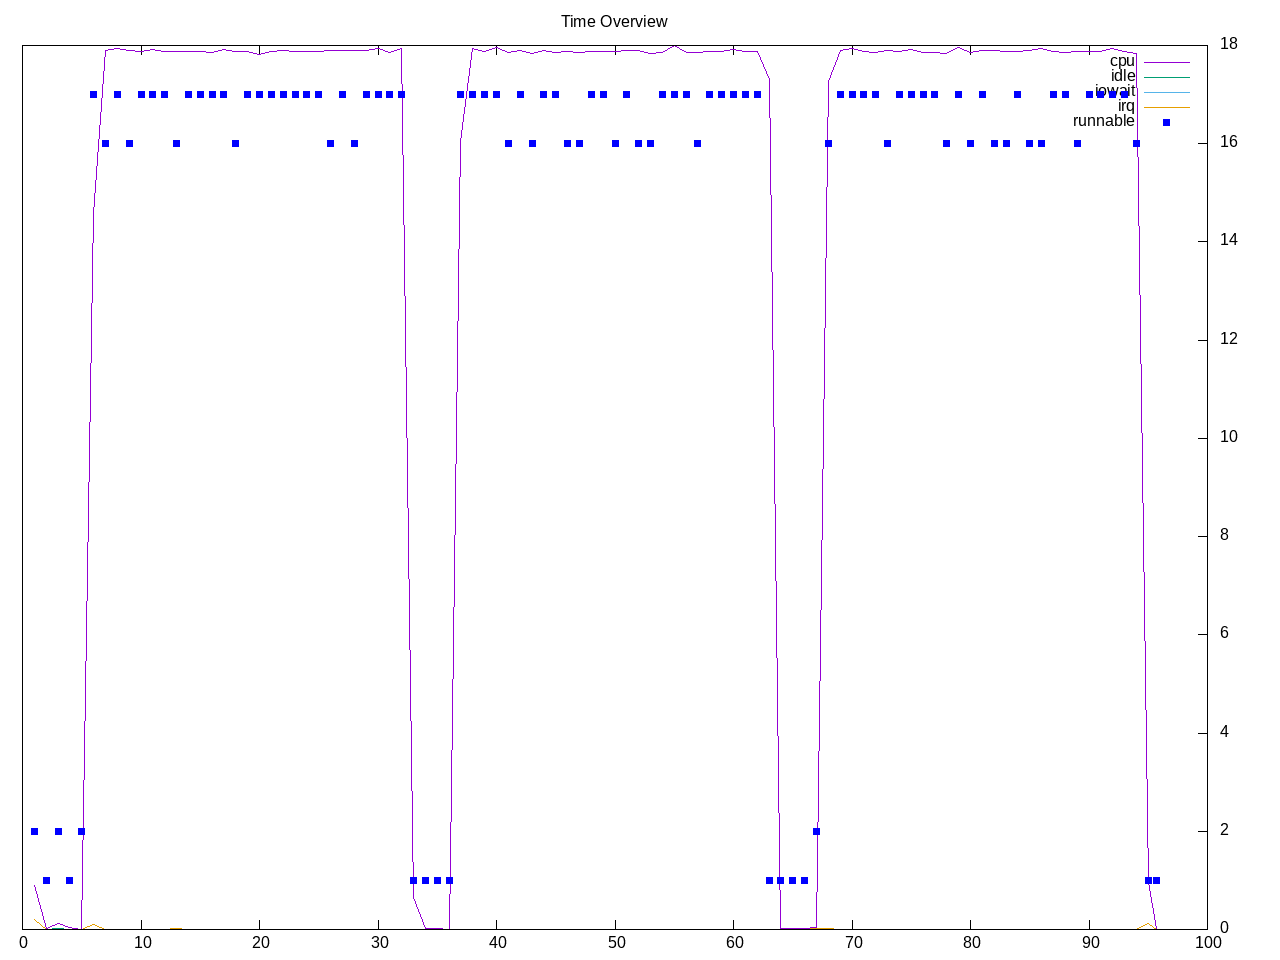
A 3D software renderer that uses OpenMP and Intel Thread Building Blocks. This test has one workload. The workload is multi-threaded and runs quickly.
Topdown metrics are dominated by backend stalls.
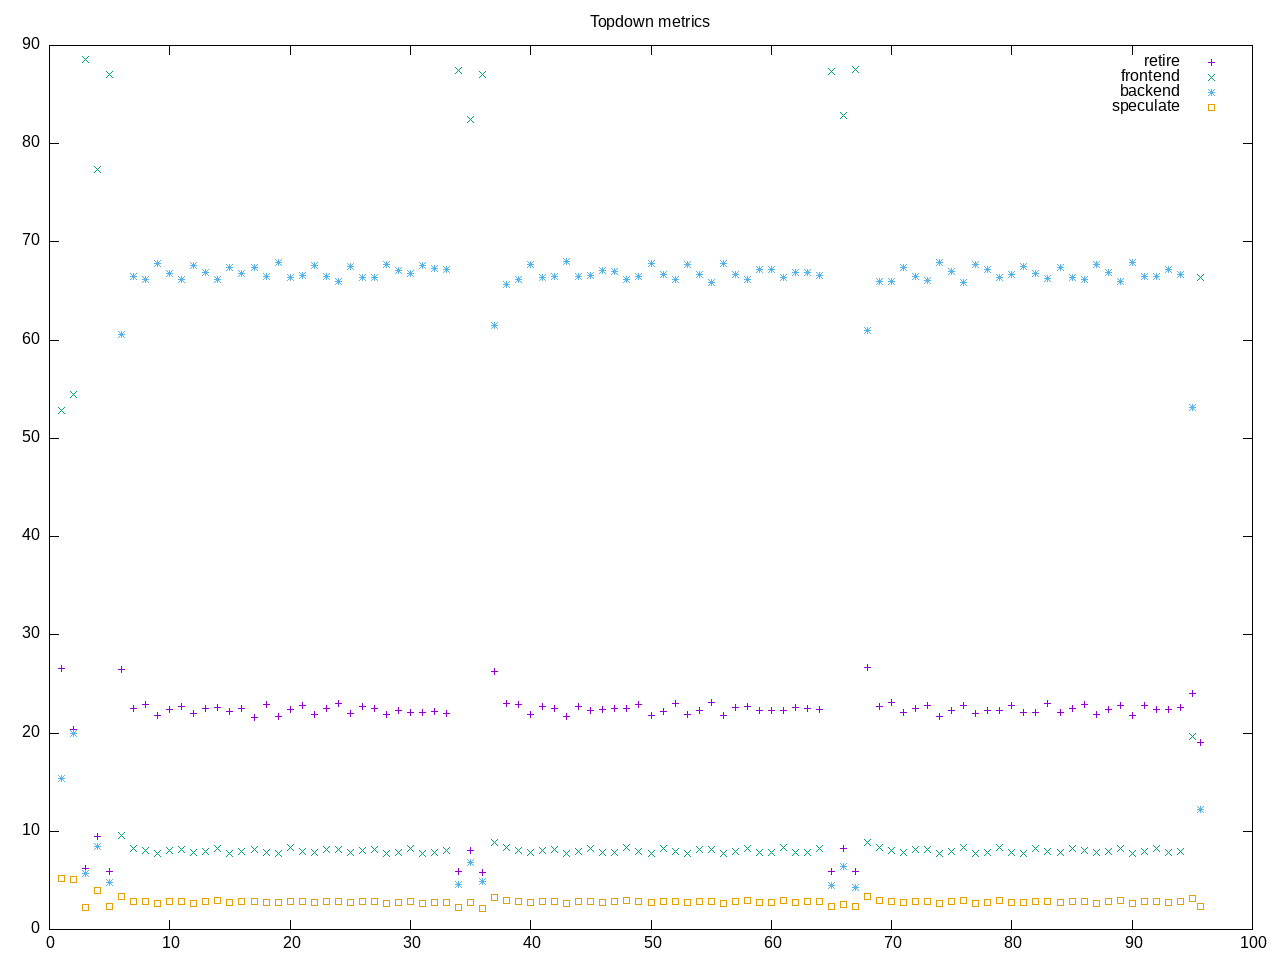
AMD metrics confirm the topdown stalls and is more CPU-bound than memory bound. This is floating point code.
elapsed              96.469
on_cpu               0.824          # 13.19 / 16 cores
utime                1271.434
stime                0.828
nvcsw                31883          # 75.38%
nivcsw               10411          # 24.62%
inblock              8              # 0.08/sec
onblock              12632          # 130.94/sec
cpu-clock            1272444095522  # 1272.444 seconds
task-clock           1272459019517  # 1272.459 seconds
page faults          145878         # 114.643/sec
context switches     42600          # 33.478/sec
cpu migrations       279            # 0.219/sec
major page faults    2              # 0.002/sec
minor page faults    145876         # 114.641/sec
alignment faults     0              # 0.000/sec
emulation faults     0              # 0.000/sec
branches             391349607640   # 89.894 branches per 1000 inst
branch misses        10754257318    # 2.75% branch miss
conditional          305970757981   # 70.283 conditional branches per 1000 inst
indirect             11845354997    # 2.721 indirect branches per 1000 inst
cpu-cycles           5344543691186  # 3.46 GHz
instructions         4348276881357  # 0.81 IPC
slots                10693312025760 #
retiring             1604929468240  # 15.0% (22.3%)
-- ucode             12995719283    #     0.1%
-- fastpath          1591933748957  #    14.9%
frontend             574101577622   #  5.4% ( 8.0%)
-- latency           236084046810   #     2.2%
-- bandwidth         338017530812   #     3.2%
backend              4809901133590  # 45.0% (66.9%)
-- cpu               2734706267287  #    25.6%
-- memory            2075194866303  #    19.4%
speculation          199470645645   #  1.9% ( 2.8%)
-- branch mispredict 198054692143   #     1.9%
-- pipeline restart  1415953502     #     0.0%
smt-contention       3504894008324  # 32.8% ( 0.0%)
cpu-cycles           5328975712732  # 3.46 GHz
instructions         4357225211014  # 0.82 IPC
instructions         1451050978351  # 13.451 l2 access per 1000 inst
l2 hit from l1       13882641022    # 41.79% l2 miss
l2 miss from l1      4418378075     #
l2 hit from l2 pf    1897404366     #
l3 hit from l2 pf    3504862131     #
l3 miss from l2 pf   233107773      #
instructions         1447220853101  # 320.239 float per 1000 inst
float 512            44             # 0.000 AVX-512 per 1000 inst
float 256            604            # 0.000 AVX-256 per 1000 inst
float 128            463456838102   # 320.239 AVX-128 per 1000 inst
float MMX            0              # 0.000 MMX per 1000 inst
float scalar         0              # 0.000 scalar per 1000 inst
instructions         4350710944191  #
opcache              553340397942   # 127.184 opcache per 1000 inst
opcache miss         4162732235     #  0.8% opcache miss rate
l1 dTLB miss         16224971580    # 3.729 L1 dTLB per 1000 inst
l2 dTLB miss         585000071      # 0.134 L2 dTLB per 1000 inst
instructions         4350509639256  #
icache               6002763036     # 1.380 icache per 1000 inst
icache miss          932442359      # 15.5% icache miss rate
l1 iTLB miss         3629974        # 0.001 L1 iTLB per 1000 inst
l2 iTLB miss         0              # 0.000 L2 iTLB per 1000 inst
tlb flush            17764          # 0.000 TLB flush per 1000 inst
Intel metrics show most memory stalls at L2 level.
elapsed              100.551
on_cpu               0.827          # 13.24 / 16 cores
utime                1329.997
stime                0.842
nvcsw                32996          # 67.94%
nivcsw               15571          # 32.06%
inblock              301688         # 3000.34/sec
onblock              1288           # 12.81/sec
cpu-clock            1330954352419  # 1330.954 seconds
task-clock           1330970775363  # 1330.971 seconds
page faults          113745         # 85.460/sec
context switches     48876          # 36.722/sec
cpu migrations       286            # 0.215/sec
major page faults    1595           # 1.198/sec
minor page faults    112150         # 84.262/sec
alignment faults     0              # 0.000/sec
emulation faults     0              # 0.000/sec
branches             343392892437   # 81.445 branches per 1000 inst
branch misses        10999047114    # 3.20% branch miss
conditional          343392903733   # 81.445 conditional branches per 1000 inst
indirect             86915724488    # 20.614 indirect branches per 1000 inst
slots                7225154861570  #
retiring             2377199852848  # 32.9% (32.9%)
-- ucode             222923249497   #     3.1%
-- fastpath          2154276603351  #    29.8%
frontend             856658332219   # 11.9% (11.9%)
-- latency           647601467795   #     9.0%
-- bandwidth         209056864424   #     2.9%
backend              3421909787471  # 47.4% (47.4%)
-- cpu               3113118947117  #    43.1%
-- memory            308790840354   #     4.3%
speculation          602695009453   #  8.3% ( 8.3%)
-- branch mispredict 591256229546   #     8.2%
-- pipeline restart  11438779907    #     0.2%
smt-contention       0              #  0.0% ( 0.0%)
cpu-cycles           2317565854634  # 1.46 GHz
instructions         2312562929728  # 1.00 IPC
l2 access            42519533920    # 18.604 l2 access per 1000 inst
l2 miss              21623683450    # 50.86% l2 miss
cpu-cycles           2291687404134  # 13.2% memory latency
load stalls          257807824450   #  0.3% l1 bound
l1 miss              251638988470   #  7.3% l2 bound
l2 miss              83527035396    #  3.5% l3 bound
l3 miss              2257341377     #  0.1% dram bound
store_stalls         44052125709    #  1.9% store bound
Process statistics show time spent in renderer process
352 processes
	 48 renderer             20199.68     2.56
	 36 clinfo                   4.11     2.07
	 38 vulkaninfo               1.14     1.15
	  4 vulkani:disk$0           0.12     0.13
	  2 llvmpipe-0               0.06     0.06
	  2 llvmpipe-1               0.06     0.06
	  2 llvmpipe-10              0.06     0.06
	  2 llvmpipe-11              0.06     0.06
	  2 llvmpipe-12              0.06     0.06
	  2 llvmpipe-13              0.06     0.06
	  2 llvmpipe-14              0.06     0.06
	  2 llvmpipe-15              0.06     0.06
	  2 llvmpipe-2               0.06     0.06
	  2 llvmpipe-3               0.06     0.06
	  2 llvmpipe-4               0.06     0.06
	  2 llvmpipe-5               0.06     0.06
	  2 llvmpipe-6               0.06     0.06
	  2 llvmpipe-7               0.06     0.06
	  2 llvmpipe-8               0.06     0.06
	  2 llvmpipe-9               0.06     0.06
	  6 clang                    0.05     0.07
	  6 php                      0.05     0.07
	  3 rocminfo                 0.03     0.00
	  1 lspci                    0.00     0.01
	  1 ps                       0.00     0.01
	 84 sh                       0.00     0.00
	 13 gcc                      0.00     0.00
	  8 stat                     0.00     0.00
	  8 systemd-detect-          0.00     0.00
	  7 gsettings                0.00     0.00
	  6 llvm-link                0.00     0.00
	  5 glxinfo                  0.00     0.00
	  5 gmain                    0.00     0.00
	  5 phoronix-test-s          0.00     0.00
	  4 dconf worker             0.00     0.00
	  3 ttsiod-renderer          0.00     0.00
	  2 cc                       0.00     0.00
	  2 grep                     0.00     0.00
	  2 lscpu                    0.00     0.00
	  2 setterm                  0.00     0.00
	  2 uname                    0.00     0.00
	  2 which                    0.00     0.00
	  1 date                     0.00     0.00
	  1 dirname                  0.00     0.00
	  1 dmesg                    0.00     0.00
	  1 dmidecode                0.00     0.00
	  1 ifconfig                 0.00     0.00
	  1 ip                       0.00     0.00
	  1 lsmod                    0.00     0.00
	  1 mktemp                   0.00     0.00
	  1 qdbus                    0.00     0.00
	  1 readlink                 0.00     0.00
	  1 realpath                 0.00     0.00
	  1 sed                      0.00     0.00
	  1 sort                     0.00     0.00
	  1 stty                     0.00     0.00
	  1 systemctl                0.00     0.00
	  1 template.sh              0.00     0.00
	  1 wc                       0.00     0.00
0 processes running
47 maximum processes
The computation blocks are simple
      11887) ttsiod-renderer  cpu=11 start=5.14  finish=32.24
        11888) renderer         cpu=14 start=5.14  finish=32.24
          11889) renderer         cpu=6 start=5.21  finish=32.24
          11890) renderer         cpu=15 start=5.21  finish=32.24
          11891) renderer         cpu=2 start=5.21  finish=32.24
          11892) renderer         cpu=4 start=5.21  finish=32.24
          11893) renderer         cpu=1 start=5.21  finish=32.24
          11894) renderer         cpu=13 start=5.21  finish=32.24
          11895) renderer         cpu=11 start=5.21  finish=32.24
          11896) renderer         cpu=0 start=5.21  finish=32.24
          11897) renderer         cpu=3 start=5.21  finish=32.24
          11898) renderer         cpu=8 start=5.21  finish=32.24
          11899) renderer         cpu=7 start=5.21  finish=32.24
          11900) renderer         cpu=12 start=5.21  finish=32.24
          11901) renderer         cpu=9 start=5.21  finish=32.24
          11902) renderer         cpu=10 start=5.21  finish=32.24
          11903) renderer         cpu=5 start=5.21  finish=32.24