
Testing lz4 with compressing and decompressing an Ubuntu ISO file. Very high speculation amounts and looks like the first workload (compression level 1) has different characteristics than the second (compression level 3) and third (compression level 9). Also the metrics for compression are much slower for levels 3 and 9. Also interesting that none tests of different compression tools use the same metrics and workload so not easy to compare between tools.
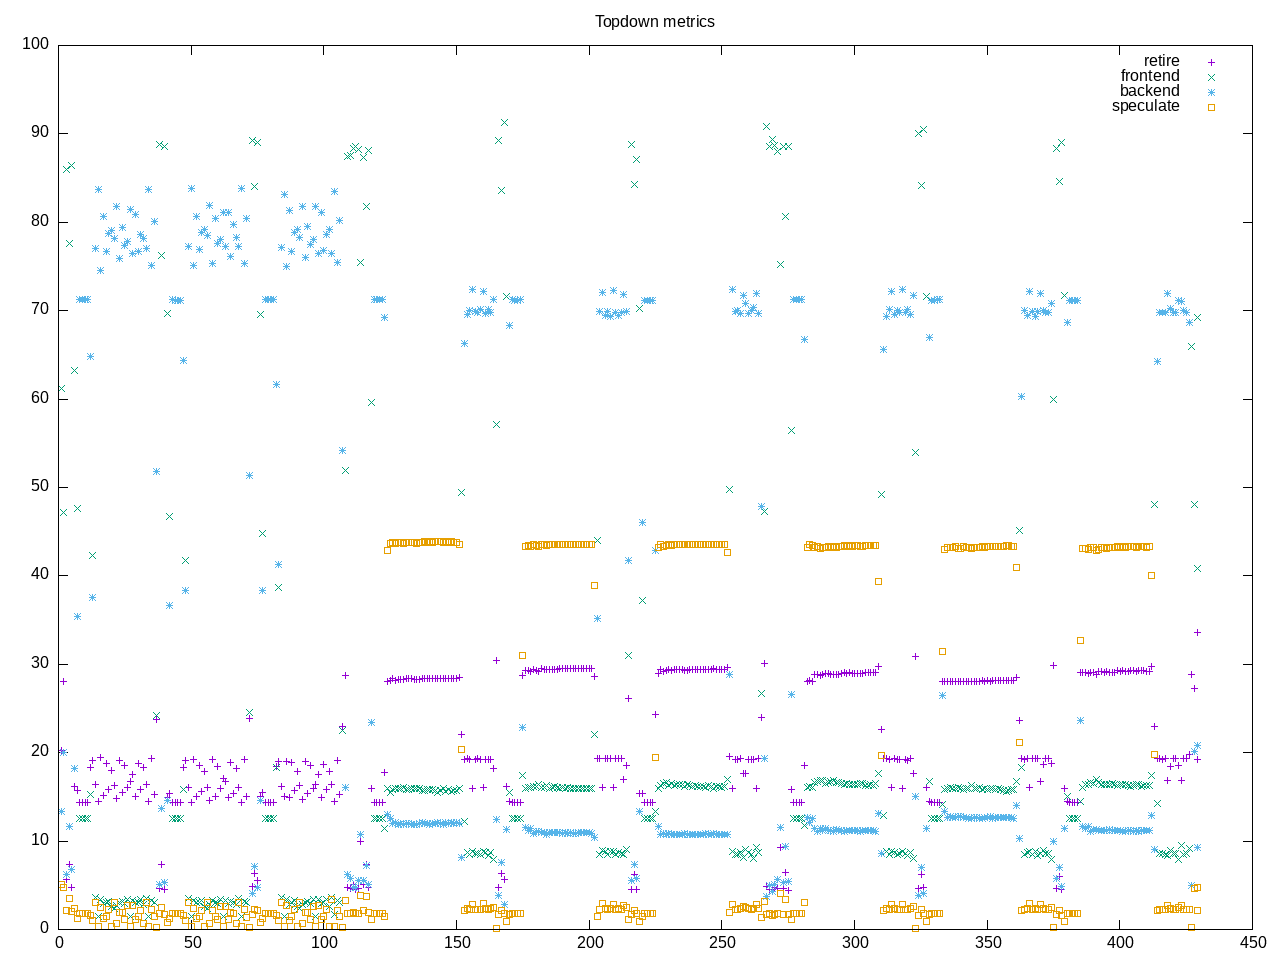
AMD metrics show a single-threaded workload with high branch misprediction.
elapsed              431.352
on_cpu               0.055          # 0.88 / 16 cores
utime                359.005
stime                20.407
nvcsw                2827           # 61.94%
nivcsw               1737           # 38.06%
inblock              4068624        # 9432.26/sec
onblock              1712           # 3.97/sec
cpu-clock            379468394089   # 379.468 seconds
task-clock           379477419868   # 379.477 seconds
page faults          13892968       # 36610.790/sec
context switches     6516           # 17.171/sec
cpu migrations       404            # 1.065/sec
major page faults    6              # 0.016/sec
minor page faults    13892962       # 36610.774/sec
alignment faults     0              # 0.000/sec
emulation faults     0              # 0.000/sec
branches             342994981953   # 124.827 branches per 1000 inst
branch misses        16699643661    # 4.87% branch miss
conditional          328758224448   # 119.646 conditional branches per 1000 inst
indirect             41443550       # 0.015 indirect branches per 1000 inst
cpu-cycles           1889122196227  # 0.27 GHz
instructions         2737446068872  # 1.45 IPC
slots                3782952328728  #
retiring             846187305931   # 22.4% (22.4%)
-- ucode             198281044      #     0.0%
-- fastpath          845989024887   #    22.4%
frontend             528484472316   # 14.0% (14.0%)
-- latency           355532417646   #     9.4%
-- bandwidth         172952054670   #     4.6%
backend              1621417936769  # 42.9% (42.9%)
-- cpu               298110098455   #     7.9%
-- memory            1323307838314  #    35.0%
speculation          786707510749   # 20.8% (20.8%)
-- branch mispredict 784728830964   #    20.7%
-- pipeline restart  1978679785     #     0.1%
smt-contention       154715438      #  0.0% ( 0.0%)
cpu-cycles           2595318207377  # 0.28 GHz
instructions         3853567369924  # 1.48 IPC
instructions         1284825674105  # 91.779 l2 access per 1000 inst
l2 hit from l1       63536670254    # 19.27% l2 miss
l2 miss from l1      493759169      #
l2 hit from l2 pf    32151337359    #
l3 hit from l2 pf    153791651      #
l3 miss from l2 pf   22078005914    #
instructions         1282592117042  # 86.140 float per 1000 inst
float 512            62             # 0.000 AVX-512 per 1000 inst
float 256            4              # 0.000 AVX-256 per 1000 inst
float 128            110482972318   # 86.140 AVX-128 per 1000 inst
float MMX            0              # 0.000 MMX per 1000 inst
float scalar         0              # 0.000 scalar per 1000 inst
Intel metrics show an even higher level of branch misprediction and relatively higher l2 miss rate.
elapsed              491.513
on_cpu               0.055          # 0.88 / 16 cores
utime                415.116
stime                19.254
nvcsw                4910           # 54.74%
nivcsw               4060           # 45.26%
inblock              4687864        # 9537.61/sec
onblock              1704           # 3.47/sec
cpu-clock            434381427808   # 434.381 seconds
task-clock           434392506214   # 434.393 seconds
page faults          13889059       # 31973.523/sec
context switches     11240          # 25.875/sec
cpu migrations       485            # 1.117/sec
major page faults    709            # 1.632/sec
minor page faults    13888350       # 31971.891/sec
alignment faults     0              # 0.000/sec
emulation faults     0              # 0.000/sec
branches             292862196279   # 119.149 branches per 1000 inst
branch misses        13029570308    # 4.45% branch miss
conditional          292862208759   # 119.149 conditional branches per 1000 inst
indirect             87813308       # 0.036 indirect branches per 1000 inst
slots                9596426393090  #
retiring             2335824751615  # 24.3% (24.3%)
-- ucode             196248424731   #     2.0%
-- fastpath          2139576326884  #    22.3%
frontend             936041875040   #  9.8% ( 9.8%)
-- latency           451564041635   #     4.7%
-- bandwidth         484477833405   #     5.0%
backend              3559540182779  # 37.1% (37.1%)
-- cpu               1019988499996  #    10.6%
-- memory            2539551682783  #    26.5%
speculation          3299242768642  # 34.4% (34.4%)
-- branch mispredict 3283919991047  #    34.2%
-- pipeline restart  15322777595    #     0.2%
smt-contention       0              #  0.0% ( 0.0%)
cpu-cycles           1605722641299  # 0.21 GHz
instructions         2460908984915  # 1.53 IPC
l2 access            160521933389   # 65.231 l2 access per 1000 inst
l2 miss              83738528448    # 52.17% l2 miss
Process level metrics show just a few invocations of lz4 and otherwise test infrastructure like clinfo taking some time.
372 processes
	  9 lz4                    357.43    19.55
	 64 clinfo                  11.52     3.52
	 38 vulkaninfo               0.93     0.95
	  6 php                      0.10     0.12
	  4 vulkani:disk$0           0.09     0.10
	  6 glxinfo:gdrv0            0.08     0.08
	  2 llvmpipe-0               0.05     0.05
	  2 llvmpipe-1               0.05     0.05
	  2 llvmpipe-10              0.05     0.05
	  2 llvmpipe-11              0.05     0.05
	  2 llvmpipe-12              0.05     0.05
	  2 llvmpipe-13              0.05     0.05
	  2 llvmpipe-14              0.05     0.05
	  2 llvmpipe-15              0.05     0.05
	  2 llvmpipe-2               0.05     0.05
	  2 llvmpipe-3               0.05     0.05
	  2 llvmpipe-4               0.05     0.05
	  2 llvmpipe-5               0.05     0.05
	  2 llvmpipe-6               0.05     0.05
	  2 llvmpipe-7               0.05     0.05
	  2 llvmpipe-8               0.05     0.05
	  2 llvmpipe-9               0.05     0.05
	  2 glxinfo                  0.04     0.04
	  2 glxinfo:cs0              0.04     0.04
	  2 glxinfo:disk$0           0.04     0.04
	  2 glxinfo:sh0              0.04     0.04
	  2 glxinfo:shlo0            0.04     0.04
	  6 clang                    0.03     0.04
	  1 lspci                    0.00     0.02
	 93 sh                       0.00     0.00
	 13 gcc                      0.00     0.00
	 10 gsettings                0.00     0.00
	  9 compress-lz4             0.00     0.00
	  9 stty                     0.00     0.00
	  8 stat                     0.00     0.00
	  8 systemd-detect-          0.00     0.00
	  6 llvm-link                0.00     0.00
	  5 phoronix-test-s          0.00     0.00
	  4 gmain                    0.00     0.00
	  2 cc                       0.00     0.00
	  2 dconf worker             0.00     0.00
	  2 lscpu                    0.00     0.00
	  2 uname                    0.00     0.00
	  2 which                    0.00     0.00
	  2 xset                     0.00     0.00
	  1 date                     0.00     0.00
	  1 dirname                  0.00     0.00
	  1 dmesg                    0.00     0.00
	  1 dmidecode                0.00     0.00
	  1 grep                     0.00     0.00
	  1 ifconfig                 0.00     0.00
	  1 ip                       0.00     0.00
	  1 lsmod                    0.00     0.00
	  1 mktemp                   0.00     0.00
	  1 ps                       0.00     0.00
	  1 qdbus                    0.00     0.00
	  1 readlink                 0.00     0.00
	  1 realpath                 0.00     0.00
	  1 sed                      0.00     0.00
	  1 sort                     0.00     0.00
	  1 systemctl                0.00     0.00
	  1 template.sh              0.00     0.00
	  1 wc                       0.00     0.00
	  1 xrandr                   0.00     0.00
0 processes running
47 maximum processes
The core benchmark block
      32236) compress-lz4 start=5.34  finish=35.63
        32237) lz4 start=5.35  finish=35.63
      32240) compress-lz4 start=39.64 finish=70.64
        32241) lz4 start=39.64 finish=70.64
      32242) compress-lz4 start=74.65 finish=105.87
        32243) lz4 start=74.65 finish=105.87
      32244) sh start=105.88 finish=105.88
        32245) sh start=105.88 finish=105.88
      32246) compress-lz4 start=116.07 finish=163.21
        32247) lz4 start=116.07 finish=163.21
      32249) compress-lz4 start=167.22 finish=214.69
        32250) lz4 start=167.22 finish=214.69
      32251) compress-lz4 start=218.70 finish=266.72
        32252) lz4 start=218.70 finish=266.72
      32284) sh start=266.72 finish=266.73
        32285) sh start=266.72 finish=266.72
      32287) compress-lz4 start=276.92 finish=324.67
        32288) lz4 start=276.92 finish=324.67
      32289) compress-lz4 start=328.68 finish=376.55
        32290) lz4 start=328.68 finish=376.55
      32291) compress-lz4 start=380.56 finish=427.71
        32292) lz4 start=380.56 finish=427.71