
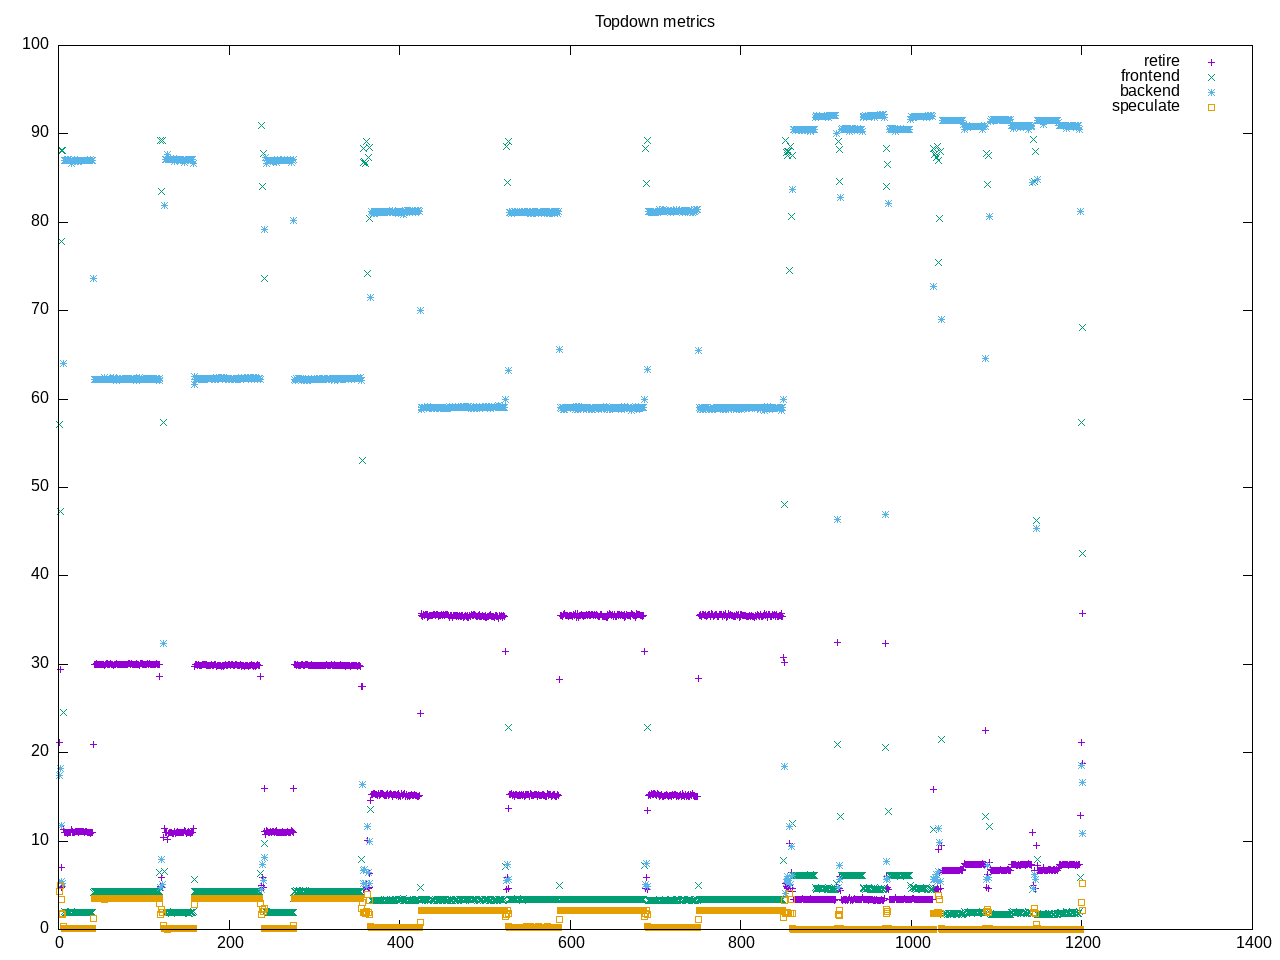
libxsmm calculates dense and sparse matrix operations. There are four different workloads with different characteristics as shown below. However, generally backend/memory bound and not much front end or speculation stalls.
AMD metrics show a backend/memory bound application with L2 misses and a moderate floating point and not many branches or speculation.
elapsed              1200.458
on_cpu               0.717          # 11.47 / 16 cores
utime                13718.215
stime                45.335
nvcsw                4385           # 2.62%
nivcsw               162934         # 97.38%
inblock              1000           # 0.83/sec
onblock              3960           # 3.30/sec
cpu-clock            13768026176988 # 13768.026 seconds
task-clock           13768338206084 # 13768.338 seconds
page faults          8547672        # 620.821/sec
context switches     173105         # 12.573/sec
cpu migrations       4624           # 0.336/sec
major page faults    5              # 0.000/sec
minor page faults    8547667        # 620.821/sec
alignment faults     0              # 0.000/sec
emulation faults     0              # 0.000/sec
branches             1857322849343  # 34.536 branches per 1000 inst
branch misses        9198990418     # 0.50% branch miss
conditional          1717674980350  # 31.939 conditional branches per 1000 inst
indirect             28717902408    # 0.534 indirect branches per 1000 inst
cpu-cycles           59079522725954 # 3.07 GHz
instructions         53707353318899 # 0.91 IPC
slots                118146870952488 #
retiring             18332446411746 # 15.5% (16.9%)
-- ucode             26086845722    #     0.0%
-- fastpath          18306359566024 #    15.5%
frontend             3910888575373  #  3.3% ( 3.6%)
-- latency           3151894748598  #     2.7%
-- bandwidth         758993826775   #     0.6%
backend              85105805287604 # 72.0% (78.5%)
-- cpu               22326738329569 #    18.9%
-- memory            62779066958035 #    53.1%
speculation          1089519233419  #  0.9% ( 1.0%)
-- branch mispredict 373902864471   #     0.3%
-- pipeline restart  715616368948   #     0.6%
smt-contention       9708155311998  #  8.2% ( 0.0%)
cpu-cycles           59091290358687 # 3.06 GHz
instructions         53737511307216 # 0.91 IPC
instructions         17913341548162 # 131.561 l2 access per 1000 inst
l2 hit from l1       1643968275128  # 11.23% l2 miss
l2 miss from l1      106129979128   #
l2 hit from l2 pf    554249205024   #
l3 hit from l2 pf    124053766622   #
l3 miss from l2 pf   34419515356    #
instructions         17910401741829 # 84.494 float per 1000 inst
float 512            43             # 0.000 AVX-512 per 1000 inst
float 256            1008           # 0.000 AVX-256 per 1000 inst
float 128            1513315108501  # 84.494 AVX-128 per 1000 inst
float MMX            0              # 0.000 MMX per 1000 inst
float scalar         0              # 0.000 scalar per 1000 inst
Intel metrics
elapsed              2522.838
on_cpu               0.682          # 10.91 / 16 cores
utime                26885.493
stime                633.641
nvcsw                155641175      # 99.83%
nivcsw               269976         # 0.17%
inblock              7240           # 2.87/sec
onblock              4072           # 1.61/sec
cpu-clock            27423281062373 # 27423.281 seconds
task-clock           27447874273562 # 27447.874 seconds
page faults          12043704       # 438.785/sec
context switches     155923601      # 5680.717/sec
cpu migrations       349702         # 12.741/sec
major page faults    97             # 0.004/sec
minor page faults    12043607       # 438.781/sec
alignment faults     0              # 0.000/sec
emulation faults     0              # 0.000/sec
branches             1325105869957  # 18.401 branches per 1000 inst
branch misses        6973190243     # 0.53% branch miss
conditional          1325105891109  # 18.401 conditional branches per 1000 inst
indirect             568603144299   # 7.896 indirect branches per 1000 inst
slots                113834189052350 #
retiring             34522415093139 # 30.3% (30.3%)
-- ucode             795046442826   #     0.7%
-- fastpath          33727368650313 #    29.6%
frontend             13659591684925 # 12.0% (12.0%)
-- latency           12302798991273 #    10.8%
-- bandwidth         1356792693652  #     1.2%
backend              64978302757717 # 57.1% (57.1%)
-- cpu               16016754739937 #    14.1%
-- memory            48961548017780 #    43.0%
speculation          858815841121   #  0.8% ( 0.8%)
-- branch mispredict 571923334820   #     0.5%
-- pipeline restart  286892506301   #     0.3%
smt-contention       0              #  0.0% ( 0.0%)
cpu-cycles           76217336930148 # 1.98 GHz
instructions         83494508679423 # 1.10 IPC
l2 access            3360799226144  # 103.904 l2 access per 1000 inst
l2 miss              555528752845   # 16.53% l2 miss
Straightforward process structure
560 processes
	192 specialized          219147.73   667.84
	 64 clinfo                  10.56     3.52
	 38 vulkaninfo               0.96     0.95
	  6 php                      0.17     0.34
	  6 glxinfo:gdrv0            0.12     0.07
	  4 vulkani:disk$0           0.11     0.10
	  2 llvmpipe-0               0.06     0.05
	  2 llvmpipe-1               0.06     0.05
	  2 llvmpipe-10              0.06     0.05
	  2 llvmpipe-11              0.06     0.05
	  2 llvmpipe-12              0.06     0.05
	  2 llvmpipe-13              0.06     0.05
	  2 llvmpipe-14              0.06     0.05
	  2 llvmpipe-15              0.06     0.05
	  2 llvmpipe-2               0.06     0.05
	  2 llvmpipe-3               0.06     0.05
	  2 llvmpipe-4               0.06     0.05
	  2 llvmpipe-5               0.06     0.05
	  2 llvmpipe-6               0.06     0.05
	  2 llvmpipe-7               0.06     0.05
	  2 llvmpipe-8               0.06     0.05
	  2 llvmpipe-9               0.06     0.05
	  2 glxinfo                  0.06     0.03
	  2 glxinfo:cs0              0.06     0.03
	  2 glxinfo:disk$0           0.06     0.03
	  2 glxinfo:sh0              0.06     0.03
	  2 glxinfo:shlo0            0.06     0.03
	  6 clang                    0.02     0.07
	  1 lspci                    0.01     0.03
	 95 sh                       0.00     0.00
	 13 gcc                      0.00     0.00
	 12 libxsmm                  0.00     0.00
	  9 stty                     0.00     0.00
	  8 stat                     0.00     0.00
	  8 systemd-detect-          0.00     0.00
	  7 gsettings                0.00     0.00
	  6 llvm-link                0.00     0.00
	  5 gmain                    0.00     0.00
	  5 phoronix-test-s          0.00     0.00
	  4 dconf worker             0.00     0.00
	  2 cc                       0.00     0.00
	  2 lscpu                    0.00     0.00
	  2 uname                    0.00     0.00
	  2 which                    0.00     0.00
	  2 xset                     0.00     0.00
	  1 date                     0.00     0.00
	  1 dirname                  0.00     0.00
	  1 dmesg                    0.00     0.00
	  1 dmidecode                0.00     0.00
	  1 grep                     0.00     0.00
	  1 ifconfig                 0.00     0.00
	  1 ip                       0.00     0.00
	  1 lsmod                    0.00     0.00
	  1 mktemp                   0.00     0.00
	  1 ps                       0.00     0.00
	  1 qdbus                    0.00     0.00
	  1 readlink                 0.00     0.00
	  1 realpath                 0.00     0.00
	  1 sed                      0.00     0.00
	  1 sort                     0.00     0.00
	  1 systemctl                0.00     0.00
	  1 template.sh              0.00     0.00
	  1 wc                       0.00     0.00
	  1 xrandr                   0.00     0.00
0 processes running
47 maximum processes
With parallel computation on all cores
      417620) libxsmm          cpu=8 start=5.70  finish=118.89
        417621) specialized      cpu=15 start=5.70  finish=118.89
          417622) specialized      cpu=1 start=5.70  finish=118.89
          417623) specialized      cpu=3 start=5.70  finish=118.89
          417624) specialized      cpu=14 start=5.70  finish=118.89
          417625) specialized      cpu=13 start=5.70  finish=118.89
          417626) specialized      cpu=4 start=5.70  finish=118.89
          417627) specialized      cpu=10 start=5.70  finish=118.89
          417628) specialized      cpu=8 start=5.70  finish=118.89
          417629) specialized      cpu=4 start=5.71  finish=118.89
          417630) specialized      cpu=12 start=5.71  finish=118.89
          417631) specialized      cpu=3 start=5.71  finish=118.89
          417632) specialized      cpu=14 start=5.71  finish=118.89
          417633) specialized      cpu=5 start=5.71  finish=118.89
          417634) specialized      cpu=11 start=5.71  finish=118.89
          417635) specialized      cpu=8 start=5.71  finish=118.89
          417636) specialized      cpu=10 start=5.71  finish=118.89