
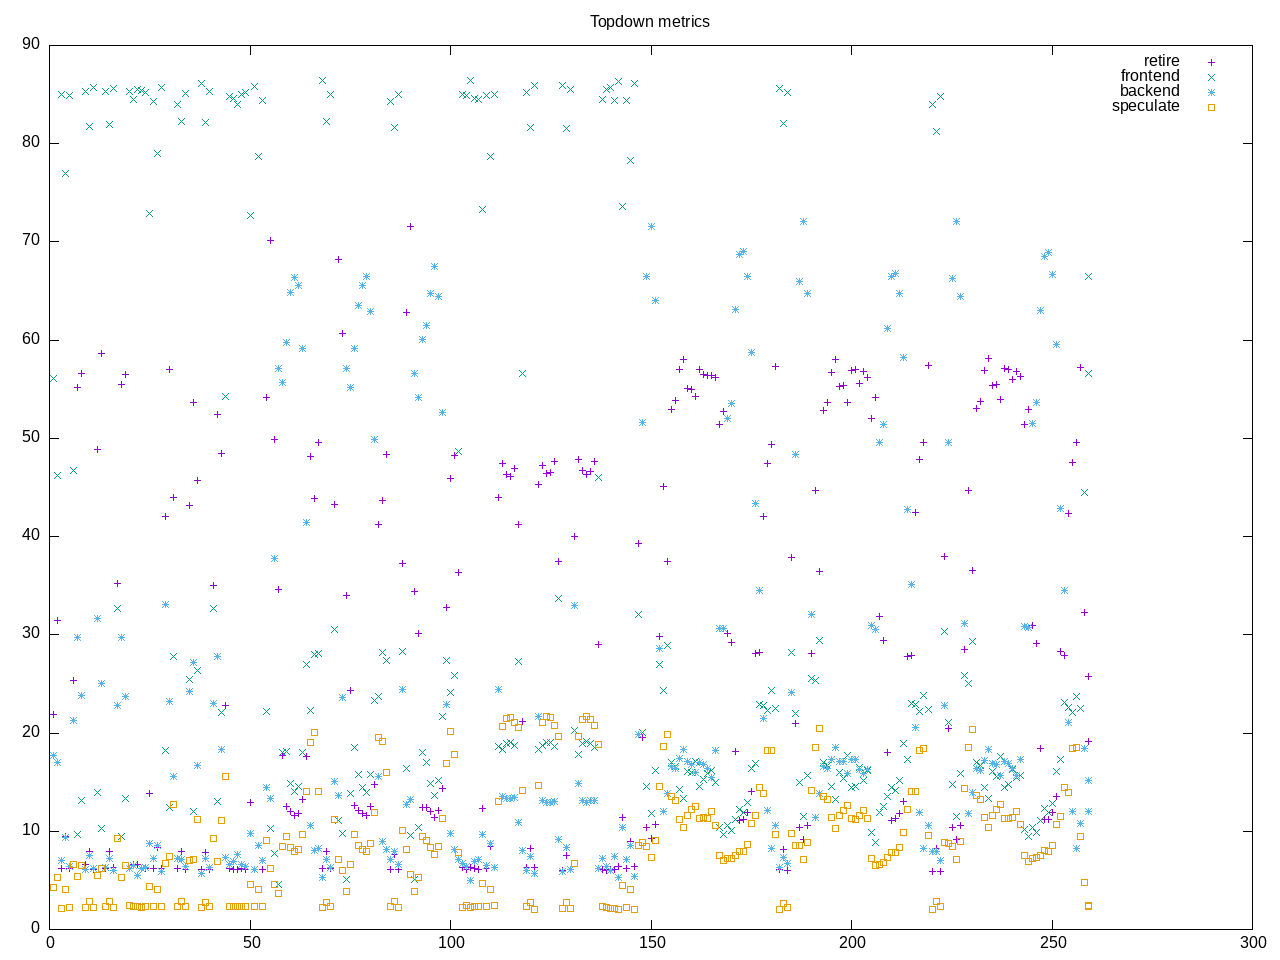
This is a test of Google’s libwebp. There are five tests with different characteristics but generally just a few threads running.

Topdown shows this has somewhat higher speculation time with a varied profile.
AMD metrics show high number of conditional branches and 3% branch miss ratio
elapsed              259.402
on_cpu               0.064          # 1.02 / 16 cores
utime                259.489
stime                5.947
nvcsw                2640           # 72.55%
nivcsw               999            # 27.45%
inblock              0              # 0.00/sec
onblock              240368         # 926.62/sec
cpu-clock            265471255850   # 265.471 seconds
task-clock           265477297262   # 265.477 seconds
page faults          3400901        # 12810.515/sec
context switches     4539           # 17.098/sec
cpu migrations       319            # 1.202/sec
major page faults    2              # 0.008/sec
minor page faults    3400899        # 12810.508/sec
alignment faults     0              # 0.000/sec
emulation faults     0              # 0.000/sec
branches             410359479521   # 151.980 branches per 1000 inst
branch misses        12595105335    # 3.07% branch miss
conditional          338774505728   # 125.468 conditional branches per 1000 inst
indirect             11288954632    # 4.181 indirect branches per 1000 inst
cpu-cycles           1208489125105  # 0.29 GHz
instructions         2695245779943  # 2.23 IPC
slots                2421004730436  #
retiring             916927391533   # 37.9% (37.9%)
-- ucode             2392968214     #     0.1%
-- fastpath          914534423319   #    37.8%
frontend             416764527628   # 17.2% (17.2%)
-- latency           238900819464   #     9.9%
-- bandwidth         177863708164   #     7.3%
backend              809540702310   # 33.4% (33.4%)
-- cpu               215619881601   #     8.9%
-- memory            593920820709   #    24.5%
speculation          277624394550   # 11.5% (11.5%)
-- branch mispredict 271447888184   #    11.2%
-- pipeline restart  6176506366     #     0.3%
smt-contention       147428348      #  0.0% ( 0.0%)
cpu-cycles           1208908612539  # 0.29 GHz
instructions         2695792729167  # 2.23 IPC
instructions         899452943096   # 16.480 l2 access per 1000 inst
l2 hit from l1       9918472214     # 33.34% l2 miss
l2 miss from l1      2035100972     #
l2 hit from l2 pf    1997801828     #
l3 hit from l2 pf    2514829497     #
l3 miss from l2 pf   391704245      #
instructions         899780198334   # 125.830 float per 1000 inst
float 512            96             # 0.000 AVX-512 per 1000 inst
float 256            760            # 0.000 AVX-256 per 1000 inst
float 128            113219444716   # 125.830 AVX-128 per 1000 inst
float MMX            0              # 0.000 MMX per 1000 inst
float scalar         0              # 0.000 scalar per 1000 inst
Intel metrics
elapsed              288.864
on_cpu               0.067          # 1.08 / 16 cores
utime                307.575
stime                4.127
nvcsw                2493           # 68.91%
nivcsw               1125           # 31.09%
inblock              18608          # 64.42/sec
onblock              229064         # 792.98/sec
cpu-clock            311721259222   # 311.721 seconds
task-clock           311728053540   # 311.728 seconds
page faults          3378818        # 10838.992/sec
context switches     4687           # 15.036/sec
cpu migrations       418            # 1.341/sec
major page faults    12             # 0.038/sec
minor page faults    3378806        # 10838.954/sec
alignment faults     0              # 0.000/sec
emulation faults     0              # 0.000/sec
branches             409445465371   # 151.679 branches per 1000 inst
branch misses        11357355020    # 2.77% branch miss
conditional          409445484315   # 151.679 conditional branches per 1000 inst
indirect             11358170633    # 4.208 indirect branches per 1000 inst
slots                7063432160630  #
retiring             2651120892393  # 37.5% (37.5%)
-- ucode             292260741628   #     4.1%
-- fastpath          2358860150765  #    33.4%
frontend             910197614075   # 12.9% (12.9%)
-- latency           311140397744   #     4.4%
-- bandwidth         599057216331   #     8.5%
backend              2110415363627  # 29.9% (29.9%)
-- cpu               855814439270   #    12.1%
-- memory            1254600924357  #    17.8%
speculation          1421621797189  # 20.1% (20.1%)
-- branch mispredict 1411554187069  #    20.0%
-- pipeline restart  10067610120    #     0.1%
smt-contention       0              #  0.0% ( 0.0%)
cpu-cycles           1178755810803  # 0.25 GHz
instructions         2698955253610  # 2.29 IPC
l2 access            43493783443    # 16.124 l2 access per 1000 inst
l2 miss              17665817237    # 40.62% l2 miss
Process overview
587 processes
	162 cwebp                  453.20     9.12
	 68 clinfo                  16.53     5.98
	 38 vulkaninfo               0.95     1.34
	  6 glxinfo:gdrv0            0.12     0.10
	  4 vulkani:disk$0           0.10     0.14
	  6 clang                    0.07     0.05
	  6 php                      0.06     0.14
	  2 glxinfo                  0.06     0.04
	  2 glxinfo:cs0              0.06     0.04
	  2 glxinfo:disk$0           0.06     0.04
	  2 glxinfo:sh0              0.06     0.04
	  2 glxinfo:shlo0            0.06     0.04
	  2 llvmpipe-0               0.05     0.07
	  2 llvmpipe-1               0.05     0.07
	  2 llvmpipe-10              0.05     0.07
	  2 llvmpipe-11              0.05     0.07
	  2 llvmpipe-12              0.05     0.07
	  2 llvmpipe-13              0.05     0.07
	  2 llvmpipe-14              0.05     0.07
	  2 llvmpipe-15              0.05     0.07
	  2 llvmpipe-2               0.05     0.07
	  2 llvmpipe-3               0.05     0.07
	  2 llvmpipe-4               0.05     0.07
	  2 llvmpipe-5               0.05     0.07
	  2 llvmpipe-6               0.05     0.07
	  2 llvmpipe-7               0.05     0.07
	  2 llvmpipe-8               0.05     0.07
	  2 llvmpipe-9               0.05     0.07
	  3 rocminfo                 0.03     0.00
	  1 lspci                    0.00     0.02
	  1 ps                       0.00     0.01
	 90 sh                       0.00     0.00
	 46 sed                      0.00     0.00
	 15 ls                       0.00     0.00
	 15 webp                     0.00     0.00
	 13 gcc                      0.00     0.00
	  9 gsettings                0.00     0.00
	  8 stat                     0.00     0.00
	  8 systemd-detect-          0.00     0.00
	  6 llvm-link                0.00     0.00
	  5 phoronix-test-s          0.00     0.00
	  4 gmain                    0.00     0.00
	  3 dconf worker             0.00     0.00
	  2 cc                       0.00     0.00
	  2 lscpu                    0.00     0.00
	  2 uname                    0.00     0.00
	  2 which                    0.00     0.00
	  2 xset                     0.00     0.00
	  1 date                     0.00     0.00
	  1 dirname                  0.00     0.00
	  1 dmesg                    0.00     0.00
	  1 dmidecode                0.00     0.00
	  1 grep                     0.00     0.00
	  1 ifconfig                 0.00     0.00
	  1 ip                       0.00     0.00
	  1 lsmod                    0.00     0.00
	  1 mktemp                   0.00     0.00
	  1 qdbus                    0.00     0.00
	  1 readlink                 0.00     0.00
	  1 realpath                 0.00     0.00
	  1 sort                     0.00     0.00
	  1 stty                     0.00     0.00
	  1 systemctl                0.00     0.00
	  1 template.sh              0.00     0.00
	  1 wc                       0.00     0.00
	  1 xrandr                   0.00     0.00
0 processes running
47 maximum processes
Core computation structure
      232586) webp             cpu=3 start=5.55  finish=7.06
        232587) cwebp            cpu=4 start=5.55  finish=7.06
          232588) cwebp            cpu=9 start=5.56  finish=5.56
            232589) cwebp            cpu=14 start=5.56  finish=5.56
          232590) cwebp            cpu=8 start=5.56  finish=5.56
          232591) cwebp            cpu=7 start=5.56  finish=5.56
            232592) cwebp            cpu=2 start=5.56  finish=5.56
            232593) sed              cpu=13 start=5.56  finish=5.56
          232594) cwebp            cpu=9 start=5.56  finish=5.57
            232595) ls               cpu=14 start=5.56  finish=5.57
            232596) sed              cpu=2 start=5.57  finish=5.57
          232597) cwebp            cpu=7 start=5.57  finish=5.57
          232598) cwebp            cpu=9 start=5.57  finish=5.57
            232599) cwebp            cpu=14 start=5.57  finish=5.57
            232600) sed              cpu=13 start=5.57  finish=5.57
          232601) cwebp            cpu=13 start=5.79  finish=5.89