
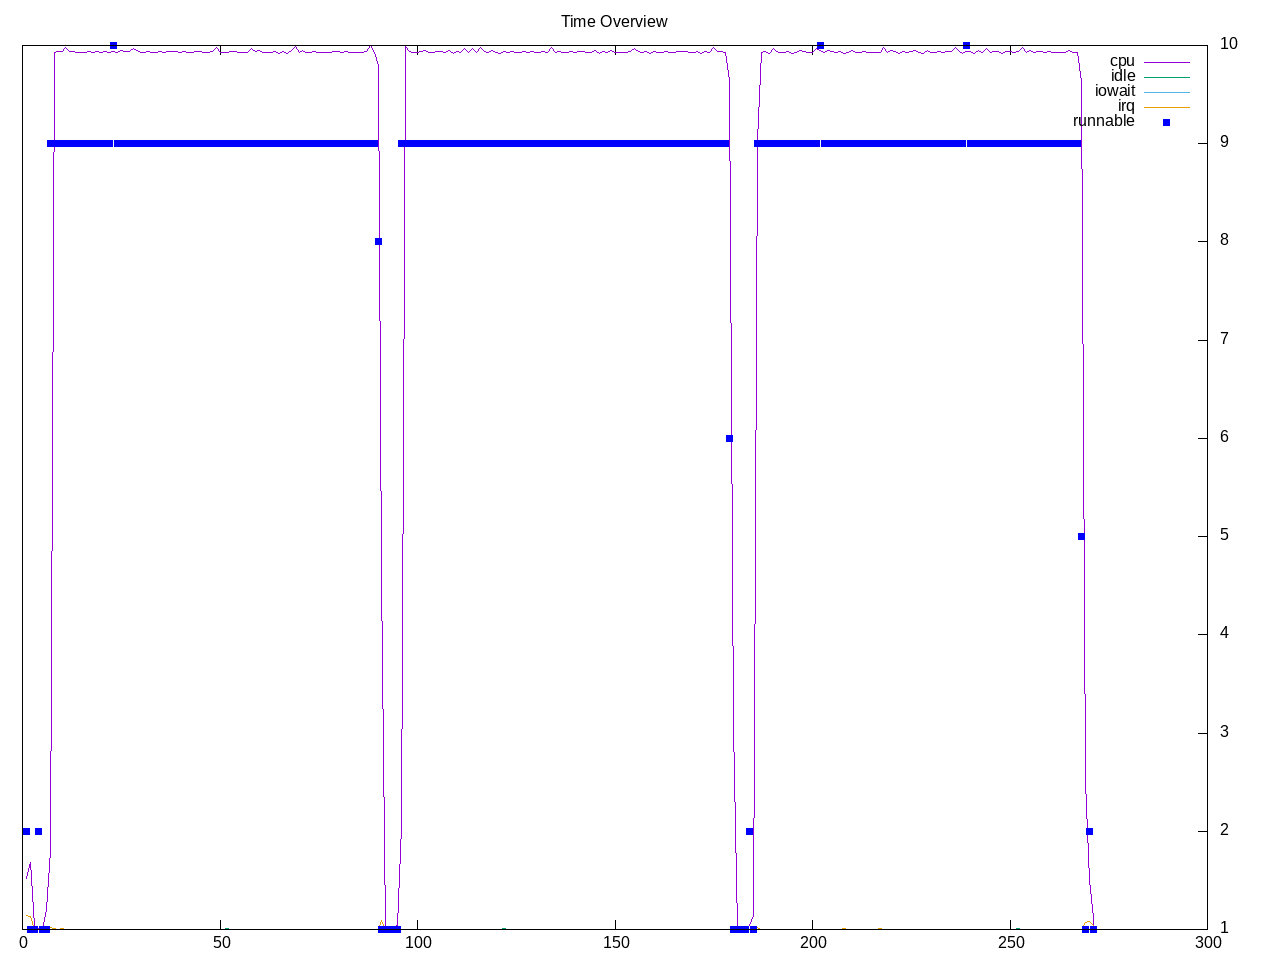
A test of Bayesian analysis with very high IPC and retirement rate. Also a case where my AMD chip is more than 2x faster than my Intel chip. Overall looks like half the cores are used.
Topdown metrics highlight a high retirement rate. The backend stalls are more because of CPU than memory.
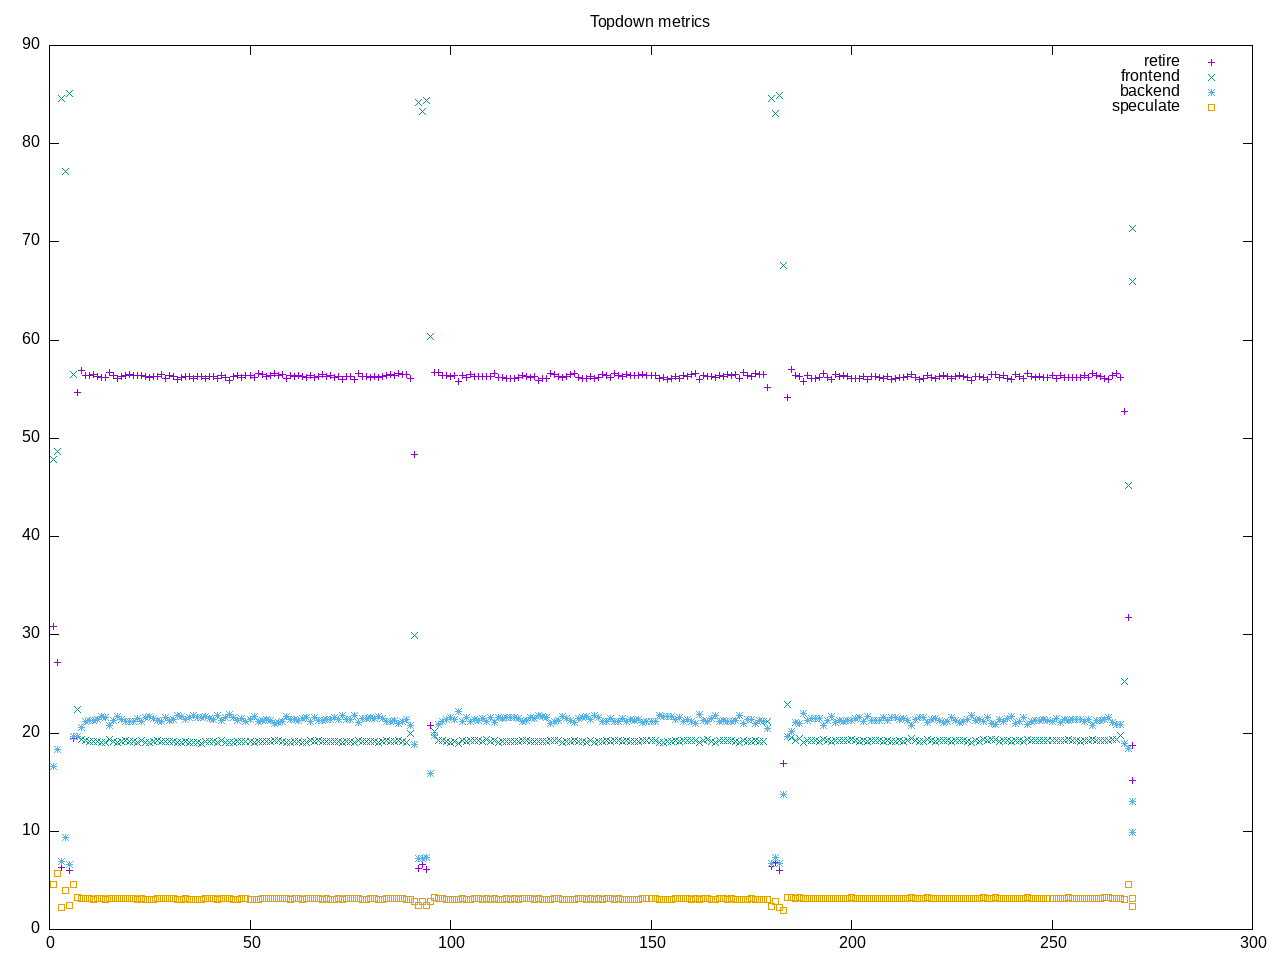
AMD metrics show floating point code, and low L2 access. I expect this is a code that mostly runs inside the smaller caches.
elapsed              269.927
on_cpu               0.463          # 7.41 / 16 cores
utime                1977.824
stime                21.480
nvcsw                85907          # 93.51%
nivcsw               5958           # 6.49%
inblock              0              # 0.00/sec
onblock              304448         # 1127.89/sec
cpu-clock            1999166570466  # 1999.167 seconds
task-clock           1999209718504  # 1999.210 seconds
page faults          204079         # 102.080/sec
context switches     93020          # 46.528/sec
cpu migrations       3757           # 1.879/sec
major page faults    21             # 0.011/sec
minor page faults    204058         # 102.069/sec
alignment faults     0              # 0.000/sec
emulation faults     0              # 0.000/sec
branches             3162931731939  # 118.634 branches per 1000 inst
branch misses        25621198898    # 0.81% branch miss
conditional          1856981848725  # 69.651 conditional branches per 1000 inst
indirect             417142083066   # 15.646 indirect branches per 1000 inst
cpu-cycles           8074389261324  # 1.87 GHz
instructions         26661505226380 # 3.30 IPC
slots                16157107428102 #
retiring             9088398115318  # 56.3% (56.3%)
-- ucode             1179133273     #     0.0%
-- fastpath          9087218982045  #    56.2%
frontend             3084602572199  # 19.1% (19.1%)
-- latency           1923637763226  #    11.9%
-- bandwidth         1160964808973  #     7.2%
backend              3449463140862  # 21.3% (21.4%)
-- cpu               2951291320114  #    18.3%
-- memory            498171820748   #     3.1%
speculation          512392460847   #  3.2% ( 3.2%)
-- branch mispredict 506025917807   #     3.1%
-- pipeline restart  6366543040     #     0.0%
smt-contention       22220399884    #  0.1% ( 0.0%)
cpu-cycles           8098416904667  # 1.86 GHz
instructions         26659435250290 # 3.29 IPC
instructions         8890128447153  # 18.809 l2 access per 1000 inst
l2 hit from l1       144952426458   # 1.71% l2 miss
l2 miss from l1      1287365557     #
l2 hit from l2 pf    20689080276    #
l3 hit from l2 pf    1567049370     #
l3 miss from l2 pf   7639525        #
instructions         8886841340745  # 201.198 float per 1000 inst
float 512            66             # 0.000 AVX-512 per 1000 inst
float 256            2078           # 0.000 AVX-256 per 1000 inst
float 128            1788012564286  # 201.198 AVX-128 per 1000 inst
float MMX            0              # 0.000 MMX per 1000 inst
float scalar         0              # 0.000 scalar per 1000 inst
Intel metrics
elapsed              588.389
on_cpu               0.571          # 9.14 / 16 cores
utime                5356.216
stime                19.068
nvcsw                125957         # 90.00%
nivcsw               14002          # 10.00%
inblock              6480           # 11.01/sec
onblock              439592         # 747.11/sec
cpu-clock            5375028742520  # 5375.029 seconds
task-clock           5375084266375  # 5375.084 seconds
page faults          188727         # 35.111/sec
context switches     142691         # 26.547/sec
cpu migrations       4349           # 0.809/sec
major page faults    87             # 0.016/sec
minor page faults    188640         # 35.095/sec
alignment faults     0              # 0.000/sec
emulation faults     0              # 0.000/sec
branches             4764011541426  # 118.508 branches per 1000 inst
branch misses        56769803842    # 1.19% branch miss
conditional          4764011554770  # 118.508 conditional branches per 1000 inst
indirect             1535012956749  # 38.184 indirect branches per 1000 inst
slots                43147684016834 #
retiring             25314831849978 # 58.7% (58.7%)
-- ucode             1933281821437  #     4.5%
-- fastpath          23381550028541 #    54.2%
frontend             5572332160739  # 12.9% (12.9%)
-- latency           1951907585256  #     4.5%
-- bandwidth         3620424575483  #     8.4%
backend              8926440911379  # 20.7% (20.7%)
-- cpu               8234468738720  #    19.1%
-- memory            691972172659   #     1.6%
speculation          3396035279367  #  7.9% ( 7.9%)
-- branch mispredict 3310807856172  #     7.7%
-- pipeline restart  85227423195    #     0.2%
smt-contention       0              #  0.0% ( 0.0%)
cpu-cycles           17676562915344 # 1.89 GHz
instructions         61132090382453 # 3.46 IPC
l2 access            346458995583   # 13.864 l2 access per 1000 inst
l2 miss              2051152576     # 0.59% l2 miss
Process summary
387 processes
	 24 mb                    1971.54    19.39
	 68 clinfo                  16.38     5.99
	 18 mpiexec                  1.73     6.87
	 38 vulkaninfo               1.31     1.13
	  6 php                      0.15     0.31
	  6 glxinfo:gdrv0            0.14     0.10
	  4 vulkani:disk$0           0.13     0.12
	  2 llvmpipe-0               0.07     0.06
	  2 llvmpipe-1               0.07     0.06
	  2 llvmpipe-10              0.07     0.06
	  2 llvmpipe-11              0.07     0.06
	  2 llvmpipe-12              0.07     0.06
	  2 llvmpipe-13              0.07     0.06
	  2 llvmpipe-14              0.07     0.06
	  2 llvmpipe-15              0.07     0.06
	  2 llvmpipe-2               0.07     0.06
	  2 llvmpipe-3               0.07     0.06
	  2 llvmpipe-4               0.07     0.06
	  2 llvmpipe-5               0.07     0.06
	  2 llvmpipe-6               0.07     0.06
	  2 llvmpipe-7               0.07     0.06
	  2 llvmpipe-8               0.07     0.06
	  2 llvmpipe-9               0.07     0.06
	  6 clang                    0.06     0.06
	  2 glxinfo                  0.06     0.04
	  2 glxinfo:cs0              0.06     0.04
	  2 glxinfo:disk$0           0.06     0.04
	  2 glxinfo:sh0              0.06     0.04
	  2 glxinfo:shlo0            0.06     0.04
	  3 rocminfo                 0.03     0.00
	  1 lspci                    0.00     0.02
	 82 sh                       0.00     0.00
	 14 gsettings                0.00     0.00
	 13 gcc                      0.00     0.00
	  8 stat                     0.00     0.00
	  8 systemd-detect-          0.00     0.00
	  6 llvm-link                0.00     0.00
	  5 phoronix-test-s          0.00     0.00
	  3 mrbayes                  0.00     0.00
	  2 cc                       0.00     0.00
	  2 lscpu                    0.00     0.00
	  2 uname                    0.00     0.00
	  2 which                    0.00     0.00
	  2 xset                     0.00     0.00
	  1 date                     0.00     0.00
	  1 dconf worker             0.00     0.00
	  1 dirname                  0.00     0.00
	  1 dmesg                    0.00     0.00
	  1 dmidecode                0.00     0.00
	  1 gmain                    0.00     0.00
	  1 grep                     0.00     0.00
	  1 ifconfig                 0.00     0.00
	  1 ip                       0.00     0.00
	  1 lsmod                    0.00     0.00
	  1 mktemp                   0.00     0.00
	  1 ps                       0.00     0.00
	  1 qdbus                    0.00     0.00
	  1 readlink                 0.00     0.00
	  1 realpath                 0.00     0.00
	  1 sed                      0.00     0.00
	  1 sort                     0.00     0.00
	  1 stty                     0.00     0.00
	  1 systemctl                0.00     0.00
	  1 template.sh              0.00     0.00
	  1 wc                       0.00     0.00
	  1 xrandr                   0.00     0.00
0 processes running
47 maximum processes
The program runs via MPI
      259388) mrbayes          cpu=2 start=5.74  finish=89.86
        259389) mpiexec          cpu=0 start=5.74  finish=89.83
          259393) mpiexec          cpu=12 start=6.32  finish=89.83
          259394) mpiexec          cpu=14 start=6.32  finish=6.32
          259395) mpiexec          cpu=11 start=6.34  finish=89.83
          259397) mpiexec          cpu=15 start=6.83  finish=89.83
          259398) mpiexec          cpu=9 start=6.83  finish=89.83
          259399) mb               cpu=8 start=6.86  finish=89.69
          259400) mb               cpu=3 start=6.86  finish=89.55
          259401) mb               cpu=12 start=6.86  finish=89.49
          259402) mb               cpu=13 start=6.87  finish=89.80
          259403) mb               cpu=14 start=6.87  finish=89.66
          259404) mb               cpu=7 start=6.88  finish=89.21
          259405) mb               cpu=2 start=6.88  finish=89.73
          259406) mb               cpu=1 start=6.88  finish=89.83