
Openjpeg is a very quick running microbenchmark. Barely five seconds per invocation.
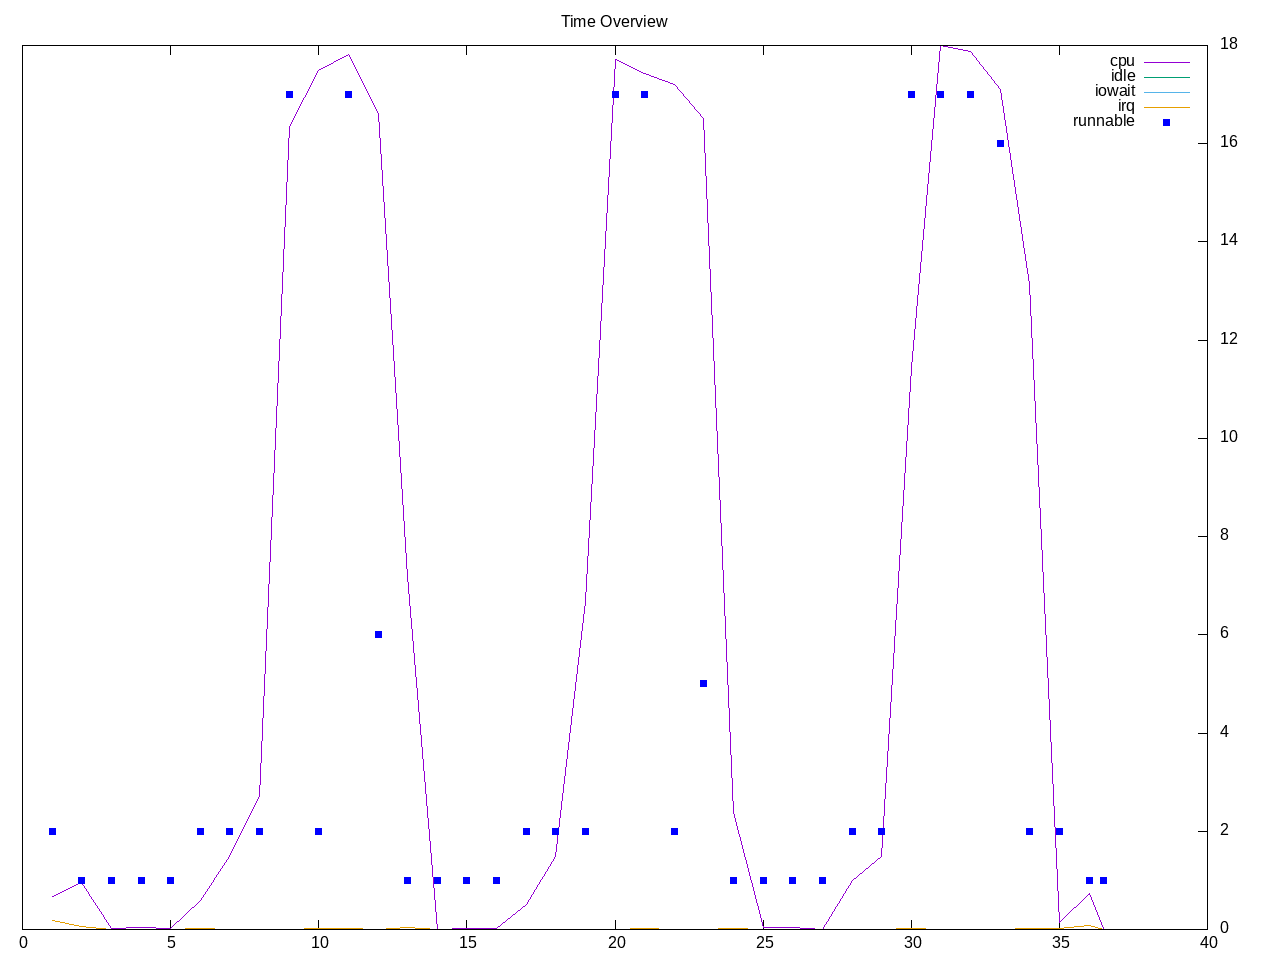
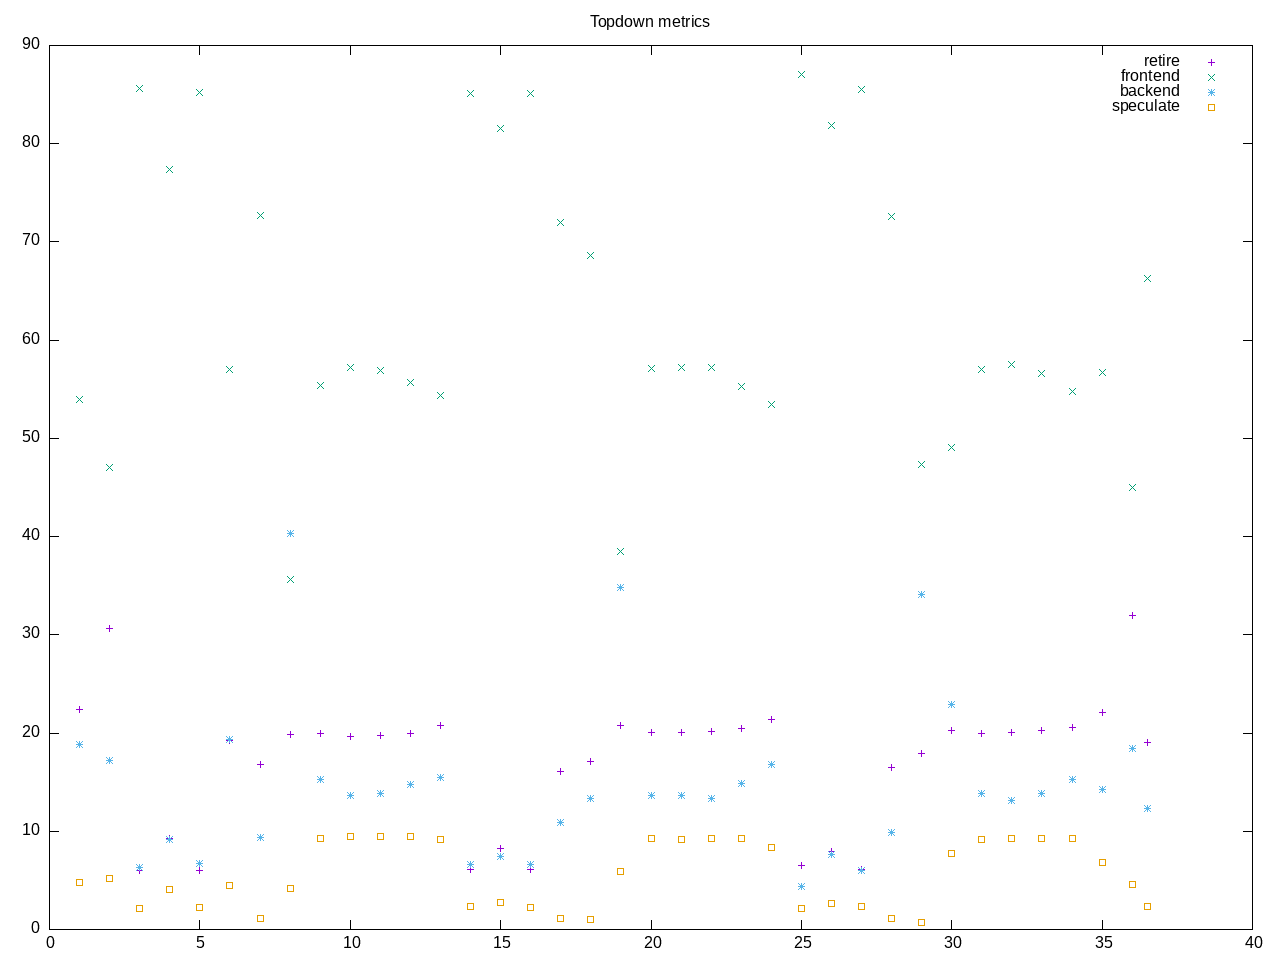
Topdown metrics also tough to see given the quick runtime but some higher frontend times with both latency and bandwidth
AMD metrics
elapsed              36.594
on_cpu               0.282          # 4.52 / 16 cores
utime                154.590
stime                10.736
nvcsw                554541         # 99.45%
nivcsw               3044           # 0.55%
inblock              0              # 0.00/sec
onblock              1592080        # 43506.24/sec
cpu-clock            165100376148   # 165.100 seconds
task-clock           165311190932   # 165.311 seconds
page faults          2412706        # 14594.934/sec
context switches     557594         # 3372.996/sec
cpu migrations       32889          # 198.952/sec
major page faults    3              # 0.018/sec
minor page faults    2412703        # 14594.916/sec
alignment faults     0              # 0.000/sec
emulation faults     0              # 0.000/sec
branches             122622194122   # 169.925 branches per 1000 inst
branch misses        13173962149    # 10.74% branch miss
conditional          105557583043   # 146.277 conditional branches per 1000 inst
indirect             936815492      # 1.298 indirect branches per 1000 inst
cpu-cycles           4454978848     # 0.08 GHz
instructions         8339672492     # 1.87 IPC
slots                9575987148     #
retiring             2996012435     # 31.3% (31.3%)
-- ucode             7993573        #     0.1%
-- fastpath          2988018862     #    31.2%
frontend             4456160818     # 46.5% (46.6%)
-- latency           3421365390     #    35.7%
-- bandwidth         1034795428     #    10.8%
backend              1616235499     # 16.9% (16.9%)
-- cpu               252357964      #     2.6%
-- memory            1363877535     #    14.2%
speculation          495471302      #  5.2% ( 5.2%)
-- branch mispredict 490561519      #     5.1%
-- pipeline restart  4909783        #     0.1%
smt-contention       11872580       #  0.1% ( 0.0%)
cpu-cycles           4336974307     # 0.08 GHz
instructions         8245407389     # 1.90 IPC
instructions         2949913646     # 33.427 l2 access per 1000 inst
l2 hit from l1       82997212       # 18.50% l2 miss
l2 miss from l1      10232759       #
l2 hit from l2 pf    7596544        #
l3 hit from l2 pf    4033408        #
l3 miss from l2 pf   3979812        #
instructions         2905810907     # 12.522 float per 1000 inst
float 512            42             # 0.000 AVX-512 per 1000 inst
float 256            18             # 0.000 AVX-256 per 1000 inst
float 128            36385074       # 12.521 AVX-128 per 1000 inst
float MMX            0              # 0.000 MMX per 1000 inst
float scalar         0              # 0.000 scalar per 1000 inst
Intel metrics show a high amount of speculation though this is also perhaps with the short runtime.
elapsed              38.306
on_cpu               0.362          # 5.79 / 16 cores
utime                214.080
stime                7.714
nvcsw                605867         # 93.18%
nivcsw               44331          # 6.82%
inblock              0              # 0.00/sec
onblock              1580840        # 41269.12/sec
cpu-clock            221449835819   # 221.450 seconds
task-clock           221595265099   # 221.595 seconds
page faults          2390649        # 10788.358/sec
context switches     650233         # 2934.327/sec
cpu migrations       62256          # 280.945/sec
major page faults    3              # 0.014/sec
minor page faults    2390646        # 10788.344/sec
alignment faults     0              # 0.000/sec
emulation faults     0              # 0.000/sec
branches             121389835828   # 168.631 branches per 1000 inst
branch misses        13049831180    # 10.75% branch miss
conditional          121389848820   # 168.631 conditional branches per 1000 inst
indirect             29846606459    # 41.462 indirect branches per 1000 inst
slots                1279821990026  #
retiring             348827985062   # 27.3% (27.3%)
-- ucode             23641140077    #     1.8%
-- fastpath          325186844985   #    25.4%
frontend             235823088930   # 18.4% (18.4%)
-- latency           121713340927   #     9.5%
-- bandwidth         114109748003   #     8.9%
backend              246983777931   # 19.3% (19.3%)
-- cpu               93937745126    #     7.3%
-- memory            153046032805   #    12.0%
speculation          464714479511   # 36.3% (36.3%)
-- branch mispredict 462567629616   #    36.1%
-- pipeline restart  2146849895     #     0.2%
smt-contention       0              #  0.0% ( 0.0%)
cpu-cycles           734041796831   # 1.21 GHz
instructions         757312439259   # 1.03 IPC
l2 access            6052244486     # 15.790 l2 access per 1000 inst
l2 miss              3489149201     # 57.65% l2 miss
Process overview suggests we mostly measure the overhead of the test suite itself though also looks like we quit prematurely.
293 processes
	 68 clinfo                  20.50     5.68
	 38 vulkaninfo               0.96     1.15
	  6 glxinfo:gdrv0            0.16     0.09
	  4 vulkani:disk$0           0.11     0.13
	  2 glxinfo                  0.08     0.03
	  2 glxinfo:cs0              0.08     0.03
	  2 glxinfo:disk$0           0.08     0.03
	  2 glxinfo:sh0              0.08     0.03
	  2 glxinfo:shlo0            0.08     0.03
	  2 llvmpipe-0               0.06     0.07
	  2 llvmpipe-1               0.06     0.07
	  2 llvmpipe-10              0.06     0.07
	  2 llvmpipe-11              0.06     0.07
	  2 llvmpipe-12              0.06     0.07
	  2 llvmpipe-13              0.06     0.07
	  2 llvmpipe-14              0.06     0.07
	  2 llvmpipe-15              0.06     0.07
	  2 llvmpipe-2               0.06     0.07
	  2 llvmpipe-3               0.06     0.07
	  2 llvmpipe-4               0.06     0.07
	  2 llvmpipe-5               0.06     0.07
	  2 llvmpipe-6               0.06     0.07
	  2 llvmpipe-7               0.06     0.07
	  2 llvmpipe-8               0.06     0.07
	  2 llvmpipe-9               0.06     0.07
	  6 php                      0.06     0.04
	  3 clang                    0.05     0.01
	  3 rocminfo                 0.03     0.00
	  1 lspci                    0.00     0.02
	 57 sh                       0.00     0.00
	 11 gsettings                0.00     0.00
	  6 gcc                      0.00     0.00
	  5 phoronix-test-s          0.00     0.00
	  5 stat                     0.00     0.00
	  4 gmain                    0.00     0.00
	  4 systemd-detect-          0.00     0.00
	  3 llvm-link                0.00     0.00
	  2 lscpu                    0.00     0.00
	  2 uname                    0.00     0.00
	  2 which                    0.00     0.00
	  2 xset                     0.00     0.00
	  1 cc                       0.00     0.00
	  1 date                     0.00     0.00
	  1 dconf worker             0.00     0.00
	  1 dirname                  0.00     0.00
	  1 dmesg                    0.00     0.00
	  1 dmidecode                0.00     0.00
	  1 grep                     0.00     0.00
	  1 ifconfig                 0.00     0.00
	  1 ip                       0.00     0.00
	  1 lsmod                    0.00     0.00
	  1 mktemp                   0.00     0.00
	  1 qdbus                    0.00     0.00
	  1 readlink                 0.00     0.00
	  1 realpath                 0.00     0.00
	  1 sed                      0.00     0.00
	  1 sort                     0.00     0.00
	  1 template.sh              0.00     0.00
	  1 wc                       0.00     0.00
	  1 xrandr                   0.00     0.00
0 processes running
47 maximum processes