
A quick running ray tracer test.
Topdown metrics shows a fairly high retirement rate limited by backend stalls of both CPU and memory.

AMD metrics show running on all cores, floating point code and not many L2 accesses or misses.
elapsed              148.090
on_cpu               0.838          # 13.40 / 16 cores
utime                1983.478
stime                1.405
nvcsw                20374          # 34.56%
nivcsw               38574          # 65.44%
inblock              0              # 0.00/sec
onblock              14056          # 94.92/sec
cpu-clock            1984937360494  # 1984.937 seconds
task-clock           1984951444204  # 1984.951 seconds
page faults          198620         # 100.063/sec
context switches     59509          # 29.980/sec
cpu migrations       2780           # 1.401/sec
major page faults    2              # 0.001/sec
minor page faults    198618         # 100.062/sec
alignment faults     0              # 0.000/sec
emulation faults     0              # 0.000/sec
branches             1014202012293  # 73.753 branches per 1000 inst
branch misses        6191746506     # 0.61% branch miss
conditional          609554742644   # 44.327 conditional branches per 1000 inst
indirect             84296971221    # 6.130 indirect branches per 1000 inst
cpu-cycles           7888007229708  # 3.32 GHz
instructions         13748191578115 # 1.74 IPC
slots                15779680550700 #
retiring             4822507950863  # 30.6% (48.6%)
-- ucode             2839998364     #     0.0%
-- fastpath          4819667952499  #    30.5%
frontend             584429036683   #  3.7% ( 5.9%)
-- latency           422768735268   #     2.7%
-- bandwidth         161660301415   #     1.0%
backend              4314856481849  # 27.3% (43.4%)
-- cpu               2741261117778  #    17.4%
-- memory            1573595364071  #    10.0%
speculation          209239720319   #  1.3% ( 2.1%)
-- branch mispredict 165667444230   #     1.0%
-- pipeline restart  43572276089    #     0.3%
smt-contention       5848634155814  # 37.1% ( 0.0%)
cpu-cycles           7888366991559  # 3.33 GHz
instructions         13756479664683 # 1.74 IPC
instructions         4587432604742  # 18.648 l2 access per 1000 inst
l2 hit from l1       76718057387    # 0.50% l2 miss
l2 miss from l1      223100129      #
l2 hit from l2 pf    8622365520     #
l3 hit from l2 pf    188302969      #
l3 miss from l2 pf   15496089       #
instructions         4578337251665  # 214.073 float per 1000 inst
float 512            51             # 0.000 AVX-512 per 1000 inst
float 256            664            # 0.000 AVX-256 per 1000 inst
float 128            980097688996   # 214.073 AVX-128 per 1000 inst
float MMX            0              # 0.000 MMX per 1000 inst
float scalar         4              # 0.000 scalar per 1000 inst
Intel metrics. The Intel version wasn’t as stable when running, perhaps differences between cores?
elapsed              807.771
on_cpu               0.880          # 14.07 / 16 cores
utime                11364.904
stime                2.490
nvcsw                80897          # 31.26%
nivcsw               177859         # 68.74%
inblock              1328           # 1.64/sec
onblock              7864           # 9.74/sec
cpu-clock            11367494151495 # 11367.494 seconds
task-clock           11367537895233 # 11367.538 seconds
page faults          360565         # 31.719/sec
context switches     262583         # 23.099/sec
cpu migrations       7004           # 0.616/sec
major page faults    14             # 0.001/sec
minor page faults    360551         # 31.718/sec
alignment faults     0              # 0.000/sec
emulation faults     0              # 0.000/sec
branches             4663954542631  # 70.318 branches per 1000 inst
branch misses        23249701772    # 0.50% branch miss
conditional          4663954574567  # 70.318 conditional branches per 1000 inst
indirect             1515855054426  # 22.855 indirect branches per 1000 inst
slots                11383013944694 #
retiring             7724310148011  # 67.9% (67.9%)
-- ucode             434825331904   #     3.8%
-- fastpath          7289484816107  #    64.0%
frontend             2693413158175  # 23.7% (23.7%)
-- latency           1649219459909  #    14.5%
-- bandwidth         1044193698266  #     9.2%
backend              741447952721   #  6.5% ( 6.5%)
-- cpu               415808685357   #     3.7%
-- memory            325639267364   #     2.9%
speculation          241057697650   #  2.1% ( 2.1%)
-- branch mispredict 230083087910   #     2.0%
-- pipeline restart  10974609740    #     0.1%
smt-contention       0              #  0.0% ( 0.0%)
cpu-cycles           6366658262732  # 2.26 GHz
instructions         12862934995320 # 2.02 IPC
l2 access            48169438096    # 6.398 l2 access per 1000 inst
l2 miss              502292780      # 1.04% l2 miss
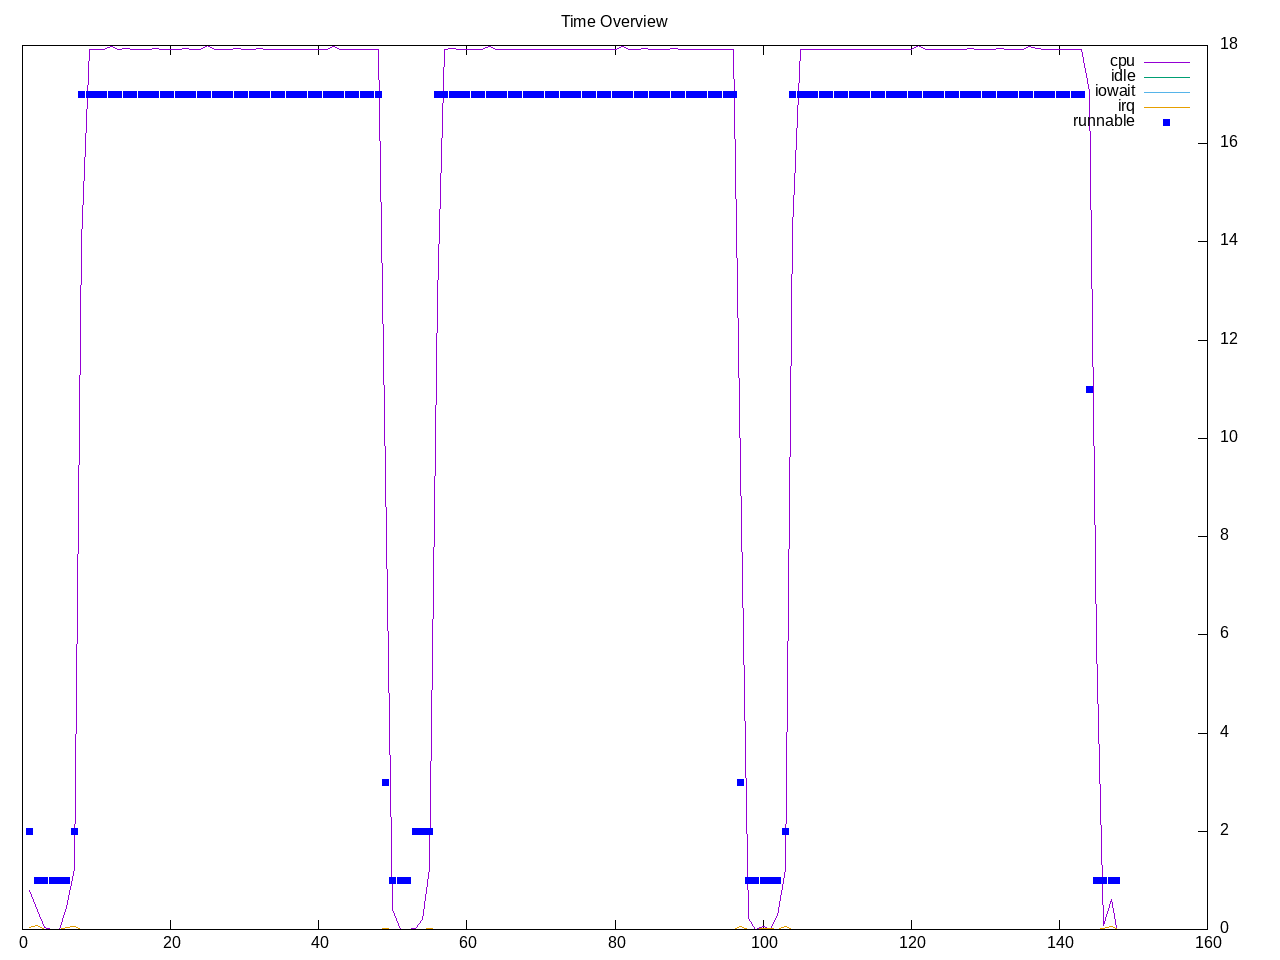
Process overview
elapsed              807.771
on_cpu               0.880          # 14.07 / 16 cores
utime                11364.904
stime                2.490
nvcsw                80897          # 31.26%
nivcsw               177859         # 68.74%
inblock              1328           # 1.64/sec
onblock              7864           # 9.74/sec
cpu-clock            11367494151495 # 11367.494 seconds
task-clock           11367537895233 # 11367.538 seconds
page faults          360565         # 31.719/sec
context switches     262583         # 23.099/sec
cpu migrations       7004           # 0.616/sec
major page faults    14             # 0.001/sec
minor page faults    360551         # 31.718/sec
alignment faults     0              # 0.000/sec
emulation faults     0              # 0.000/sec
branches             4663954542631  # 70.318 branches per 1000 inst
branch misses        23249701772    # 0.50% branch miss
conditional          4663954574567  # 70.318 conditional branches per 1000 inst
indirect             1515855054426  # 22.855 indirect branches per 1000 inst
slots                11383013944694 #
retiring             7724310148011  # 67.9% (67.9%)
-- ucode             434825331904   #     3.8%
-- fastpath          7289484816107  #    64.0%
frontend             2693413158175  # 23.7% (23.7%)
-- latency           1649219459909  #    14.5%
-- bandwidth         1044193698266  #     9.2%
backend              741447952721   #  6.5% ( 6.5%)
-- cpu               415808685357   #     3.7%
-- memory            325639267364   #     2.9%
speculation          241057697650   #  2.1% ( 2.1%)
-- branch mispredict 230083087910   #     2.0%
-- pipeline restart  10974609740    #     0.1%
smt-contention       0              #  0.0% ( 0.0%)
cpu-cycles           6366658262732  # 2.26 GHz
instructions         12862934995320 # 2.02 IPC
l2 access            48169438096    # 6.398 l2 access per 1000 inst
l2 miss              502292780      # 1.04% l2 miss
Computation block
      2580699) povray           cpu=8 start=53.46 finish=97.40
        2580700) povray           cpu=9 start=53.46 finish=53.46
        2580701) povray           cpu=8 start=53.46 finish=97.39
          2580702) povray           cpu=3 start=53.46 finish=97.40
          2580703) povray           cpu=13 start=53.46 finish=97.39
            2580704) povray           cpu=3 start=53.47 finish=97.34
              2580705) povray           cpu=15 start=53.72 finish=97.14
                2580706) povray           cpu=9 start=53.72 finish=53.96
                2580707) povray           cpu=0 start=53.96 finish=53.96
              2580708) povray           cpu=5 start=53.97 finish=97.14
                2580709) povray           cpu=9 start=53.97 finish=53.97
                2580710) povray           cpu=10 start=53.97 finish=53.97
                2580711) povray           cpu=9 start=54.02 finish=55.04
                2580712) povray           cpu=10 start=54.02 finish=54.20
                2580713) povray           cpu=11 start=54.02 finish=54.02
                2580714) ?? cpu=0 start=54.03 finish=0.00
                2580715) povray           cpu=15 start=54.03 finish=54.03
                2580716) povray           cpu=4 start=54.03 finish=54.03
                2580717) povray           cpu=14 start=54.03 finish=54.03
                2580718) povray           cpu=13 start=54.03 finish=54.03
                2580719) povray           cpu=11 start=54.03 finish=54.03
                2580720) povray           cpu=15 start=54.03 finish=54.03
                2580721) povray           cpu=12 start=54.03 finish=54.03
                2580722) povray           cpu=13 start=54.03 finish=54.03
                2580723) povray           cpu=13 start=54.03 finish=54.03
                2580724) povray           cpu=14 start=54.03 finish=54.03
                2580725) povray           cpu=13 start=54.03 finish=54.03
                2580726) povray           cpu=13 start=54.03 finish=54.03
                2580727) povray           cpu=9 start=55.08 finish=55.09
                2580728) povray           cpu=9 start=55.13 finish=95.89
                2580729) povray           cpu=3 start=55.13 finish=95.84
                2580730) povray           cpu=13 start=55.13 finish=96.33
                2580731) povray           cpu=14 start=55.13 finish=96.38
                2580732) povray           cpu=10 start=55.13 finish=96.65
                2580733) povray           cpu=11 start=55.13 finish=96.66
                2580734) povray           cpu=15 start=55.13 finish=96.56
                2580735) povray           cpu=12 start=55.13 finish=96.40
                2580736) povray           cpu=0 start=55.13 finish=95.82
                2580737) povray           cpu=8 start=55.13 finish=95.96
                2580738) povray           cpu=11 start=55.13 finish=95.81
                2580739) povray           cpu=0 start=55.13 finish=96.84
                2580740) povray           cpu=9 start=55.13 finish=97.00
                2580741) povray           cpu=15 start=55.13 finish=95.82
                2580742) povray           cpu=1 start=55.13 finish=96.27
                2580743) povray           cpu=2 start=55.13 finish=95.92