
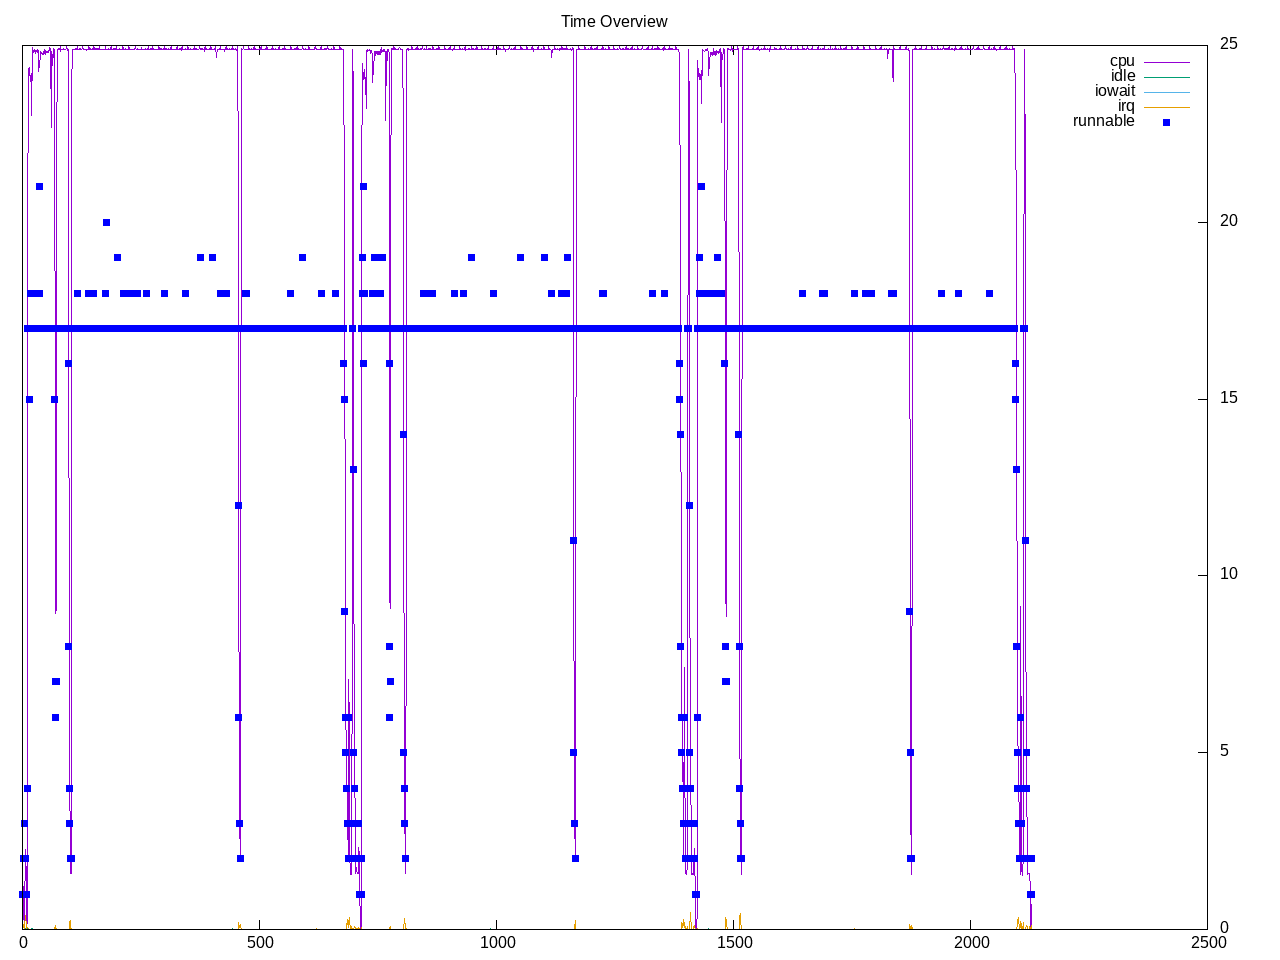
A test of building the node.js javascript engine. This code is longer than several of the “build-*” workloads, though not quite as fast as build-gcc or build-llvm. Similar to other build workloads there is a high number of processes, number of frontend stalls. In contrast to some others, there is somewhat higher backend stalls. This code has some “cleanup phases before each run that also look reflected in the compilation. Also looks like mostly parallel compilation with one serializing (link?) half way through and greater serialization towards end of the workload.
Topdown profile shows those general periods of higher frontend stalls. Also looks like the “cleanup” before each workload has different profile.
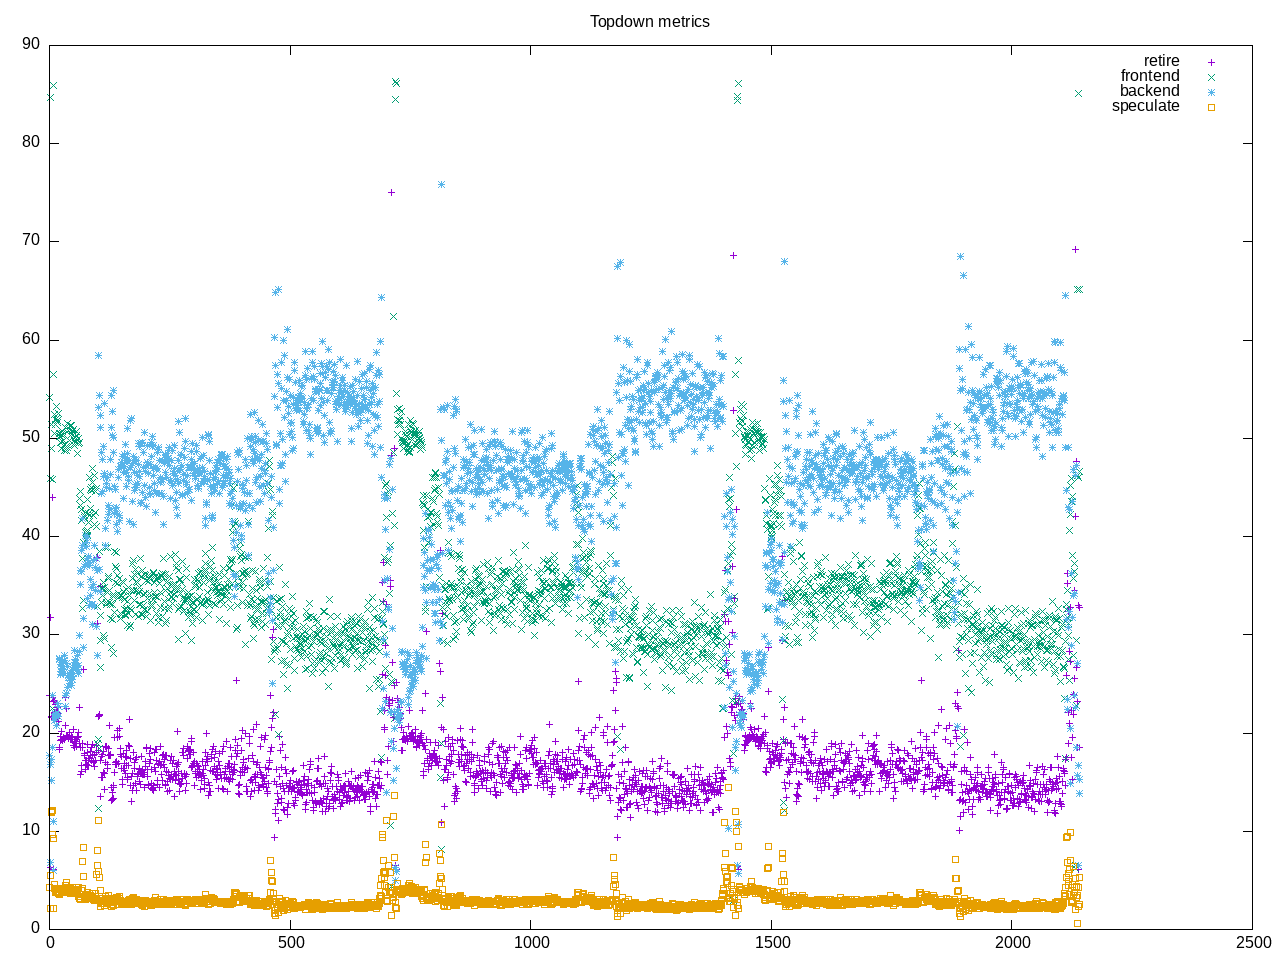
AMD metrics show ~1/5 instructions is a branch with little floating point code.
elapsed              2144.566
on_cpu               0.941          # 15.05 / 16 cores
utime                30188.340
stime                2091.837
nvcsw                807175         # 44.88%
nivcsw               991151         # 55.12%
inblock              0              # 0.00/sec
onblock              12258648       # 5716.14/sec
cpu-clock            32279798809815 # 32279.799 seconds
task-clock           32280195435292 # 32280.195 seconds
page faults          642525533      # 19904.636/sec
context switches     1568781        # 48.599/sec
cpu migrations       73009          # 2.262/sec
major page faults    1676           # 0.052/sec
minor page faults    642523857      # 19904.584/sec
alignment faults     0              # 0.000/sec
emulation faults     0              # 0.000/sec
branches             21649570910307 # 211.978 branches per 1000 inst
branch misses        542079184612   # 2.50% branch miss
conditional          16952172427646 # 165.984 conditional branches per 1000 inst
indirect             430406042887   # 4.214 indirect branches per 1000 inst
cpu-cycles           133548357863790 # 3.89 GHz
instructions         101428319812801 # 0.76 IPC
slots                268650189068820 #
retiring             32676831786963 # 12.2% (16.3%)
-- ucode             21498857071    #     0.0%
-- fastpath          32655332929892 #    12.2%
frontend             69755359369146 # 26.0% (34.8%)
-- latency           52488811107576 #    19.5%
-- bandwidth         17266548261570 #     6.4%
backend              92552250002478 # 34.5% (46.1%)
-- cpu               6556257702259  #     2.4%
-- memory            85995992300219 #    32.0%
speculation          5716339764160  #  2.1% ( 2.8%)
-- branch mispredict 5651531115706  #     2.1%
-- pipeline restart  64808648454    #     0.0%
smt-contention       67949097952459 # 25.3% ( 0.0%)
cpu-cycles           133519263543635 # 3.88 GHz
instructions         101430105523798 # 0.76 IPC
instructions         33965954644499 # 69.306 l2 access per 1000 inst
l2 hit from l1       1830068894706  # 22.58% l2 miss
l2 miss from l1      323908834364   #
l2 hit from l2 pf    316444081333   #
l3 hit from l2 pf    101163396524   #
l3 miss from l2 pf   106365283407   #
instructions         33946845258090 # 15.153 float per 1000 inst
float 512            81194          # 0.000 AVX-512 per 1000 inst
float 256            2345789        # 0.000 AVX-256 per 1000 inst
float 128            514401099938   # 15.153 AVX-128 per 1000 inst
float MMX            0              # 0.000 MMX per 1000 inst
float scalar         8              # 0.000 scalar per 1000 inst
Intel metrics
elapsed              2512.218
on_cpu               0.945          # 15.12 / 16 cores
utime                36117.910
stime                1854.539
nvcsw                878304         # 45.90%
nivcsw               1035202        # 54.10%
inblock              102096         # 40.64/sec
onblock              12247440       # 4875.15/sec
cpu-clock            37972118857909 # 37972.119 seconds
task-clock           37972545348380 # 37972.545 seconds
page faults          642330574      # 16915.658/sec
context switches     1691066        # 44.534/sec
cpu migrations       84049          # 2.213/sec
major page faults    1076           # 0.028/sec
minor page faults    642329498      # 16915.629/sec
alignment faults     0              # 0.000/sec
emulation faults     0              # 0.000/sec
branches             21432898419363 # 210.396 branches per 1000 inst
branch misses        411236524227   # 1.92% branch miss
conditional          21432906380163 # 210.396 conditional branches per 1000 inst
indirect             3716689790845  # 36.485 indirect branches per 1000 inst
slots                182247267068792 #
retiring             54162825882165 # 29.7% (29.7%)
-- ucode             4366997381232  #     2.4%
-- fastpath          49795828500933 #    27.3%
frontend             55027280352127 # 30.2% (30.2%)
-- latency           33598971511576 #    18.4%
-- bandwidth         21428308840551 #    11.8%
backend              56316877227342 # 30.9% (30.9%)
-- cpu               12654035624989 #     6.9%
-- memory            43662841602353 #    24.0%
speculation          17013502249974 #  9.3% ( 9.3%)
-- branch mispredict 16365820969817 #     9.0%
-- pipeline restart  647681280157   #     0.4%
smt-contention       0              #  0.0% ( 0.0%)
cpu-cycles           81430819711470 # 2.03 GHz
instructions         79248849727315 # 0.97 IPC
l2 access            3923871673155  # 68.114 l2 access per 1000 inst
l2 miss              1327323041163  # 33.83% l2 miss
Process overview suggests ~2/3 C++ compilation and ~1/3 C compilation in terms of files, but much more time spent in the C++ compilation. Overall a quarter million processes
248492 processes
	7231 cc1plus              29340.31  1605.19
	3882 cc1                    464.31    56.24
	 36 ld                      23.74     9.48
	11158 as                      23.09     1.92
	 65 clinfo                  18.13     6.67
	  6 make                    11.97    18.56
	  3 torque                  10.78     0.23
	  3 xz                       4.32     0.43
	 37 python                   4.17     0.46
	 36 python3.10               3.14     0.24
	 18 node_mksnapshot          3.12     0.54
	  3 mksnapshot               2.86     0.23
	117 ar                       1.70     1.71
	 38 vulkaninfo               1.13     1.52
	  3 genccode                 0.49     0.29
	  6 php                      0.21     0.53
	  6 glxinfo:gdrv0            0.19     0.07
	  3 tar                      0.12     2.75
	  4 vulkani:disk$0           0.12     0.16
	  2 glxinfo                  0.09     0.03
	  2 glxinfo:cs0              0.09     0.03
	  2 glxinfo:disk$0           0.09     0.03
	  2 glxinfo:sh0              0.09     0.03
	  2 glxinfo:shlo0            0.09     0.03
	  2 llvmpipe-0               0.06     0.08
	  2 llvmpipe-1               0.06     0.08
	  2 llvmpipe-10              0.06     0.08
	  2 llvmpipe-11              0.06     0.08
	  2 llvmpipe-12              0.06     0.08
	  2 llvmpipe-13              0.06     0.08
	  2 llvmpipe-14              0.06     0.08
	  2 llvmpipe-15              0.06     0.08
	  2 llvmpipe-2               0.06     0.08
	  2 llvmpipe-3               0.06     0.08
	  2 llvmpipe-4               0.06     0.08
	  2 llvmpipe-5               0.06     0.08
	  2 llvmpipe-6               0.06     0.08
	  2 llvmpipe-7               0.06     0.08
	  2 llvmpipe-8               0.06     0.08
	  2 llvmpipe-9               0.06     0.08
	11325 rm                       0.05     2.43
	  3 icupkg                   0.05     0.19
	  6 clang                    0.05     0.07
	 45 V8 DefaultWorke          0.00    42.90
	  3 cp                       0.00     0.11
	3942 cc                       0.00     0.03
	  3 find                     0.00     0.03
	  3 rocminfo                 0.00     0.03
	  1 lspci                    0.00     0.03
	  1 ps                       0.00     0.01
	123565 sh                       0.00     0.00
	33622 sed                      0.00     0.00
	11553 mkdir                    0.00     0.00
	11376 printf                   0.00     0.00
	11296 touch                    0.00     0.00
	11208 grep                     0.00     0.00
	7263 g++                      0.00     0.00
	117 dirname                  0.00     0.00
	 36 collect2                 0.00     0.00
	 22 gcc                      0.00     0.00
	 17 uname                    0.00     0.00
	 15 tr                       0.00     0.00
	 10 gsettings                0.00     0.00
	  8 stat                     0.00     0.00
	  8 systemd-detect-          0.00     0.00
	  6 llvm-link                0.00     0.00
	  5 phoronix-test-s          0.00     0.00
	  4 bash                     0.00     0.00
	  3 build-nodejs             0.00     0.00
	  3 bytecode_builti          0.00     0.00
	  3 dconf worker             0.00     0.00
	  3 gen-regexp-spec          0.00     0.00
	  3 gmain                    0.00     0.00
	  3 ld.gold                  0.00     0.00
	  3 ln                       0.00     0.00
	  2 lscpu                    0.00     0.00
	  2 which                    0.00     0.00
	  2 xset                     0.00     0.00
	  1 date                     0.00     0.00
	  1 dmesg                    0.00     0.00
	  1 dmidecode                0.00     0.00
	  1 ifconfig                 0.00     0.00
	  1 ip                       0.00     0.00
	  1 lsmod                    0.00     0.00
	  1 mktemp                   0.00     0.00
	  1 python3                  0.00     0.00
	  1 qdbus                    0.00     0.00
	  1 readlink                 0.00     0.00
	  1 realpath                 0.00     0.00
	  1 sort                     0.00     0.00
	  1 stty                     0.00     0.00
	  1 systemctl                0.00     0.00
	  1 template.sh              0.00     0.00
	  1 wc                       0.00     0.00
	  1 xrandr                   0.00     0.00
189 processes running
236 maximum processes