
A stress engine of various Linux operations with 39 workload tests around various system calls. As might be expected there is a somewhat differing set of workloads for different system calls and similarly at least one that tries having a large number of runnable processes and some that test interrupt behavior.
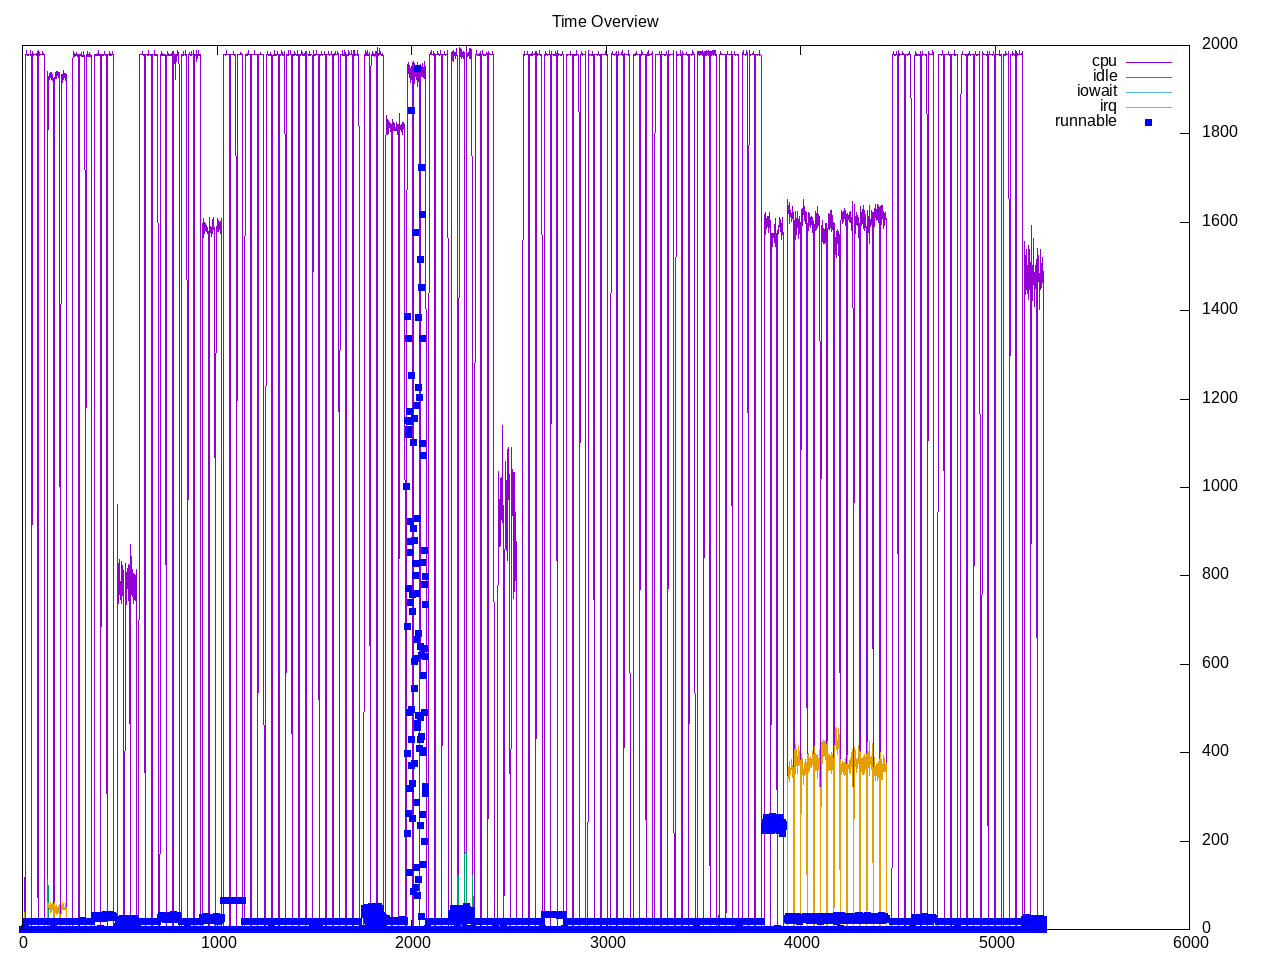
Topdown overview shows similar behavior all over the map. To dive deeper, makes sense to separate out the workloads.

Composite is shown in AMD topdown metrics. Overall keeping most cores busy. Some floating point and a reasonable number of branches.
elapsed              5084.757
on_cpu               0.773          # 12.37 / 16 cores
utime                32335.341
stime                30543.925
nvcsw                798829363      # 24.59%
nivcsw               2449890031     # 75.41%
inblock              6920           # 1.36/sec
onblock              22937248       # 4510.98/sec
cpu-clock            63338126482931 # 63338.126 seconds
task-clock           63370492886426 # 63370.493 seconds
page faults          252282205      # 3981.067/sec
context switches     3247234343     # 51242.056/sec
cpu migrations       40594272       # 640.586/sec
major page faults    3885           # 0.061/sec
minor page faults    244989996      # 3865.995/sec
alignment faults     0              # 0.000/sec
emulation faults     0              # 0.000/sec
branches             33287849051067 # 134.232 branches per 1000 inst
branch misses        2040381135392  # 6.13% branch miss
conditional          21738326981131 # 87.659 conditional branches per 1000 inst
indirect             1043706930671  # 4.209 indirect branches per 1000 inst
cpu-cycles           246020356645369 # 3.02 GHz
instructions         247522262682045 # 1.01 IPC
slots                494262022605330 #
retiring             91346010020862 # 18.5% (23.6%)
-- ucode             458614951576   #     0.1%
-- fastpath          90887395069286 #    18.4%
frontend             175331383055920 # 35.5% (45.4%)
-- latency           138264249623772 #    28.0%
-- bandwidth         37067133432148 #     7.5%
backend              116225434441614 # 23.5% (30.1%)
-- cpu               36027639621668 #     7.3%
-- memory            80197794819946 #    16.2%
speculation          3425655658401  #  0.7% ( 0.9%)
-- branch mispredict 3407508332244  #     0.7%
-- pipeline restart  18147326157    #     0.0%
smt-contention       107922040366956 # 21.8% ( 0.0%)
cpu-cycles           237754882893348 # 3.02 GHz
instructions         245483193483317 # 1.03 IPC
instructions         82870905019605 # 29.832 l2 access per 1000 inst
l2 hit from l1       1876625583798  # 11.86% l2 miss
l2 miss from l1      121920128803   #
l2 hit from l2 pf    424202227051   #
l3 hit from l2 pf    109437666801   #
l3 miss from l2 pf   61904909671    #
instructions         82821378194925 # 95.294 float per 1000 inst
float 512            180            # 0.000 AVX-512 per 1000 inst
float 256            3512658061     # 0.042 AVX-256 per 1000 inst
float 128            7888690609108  # 95.249 AVX-128 per 1000 inst
float MMX            0              # 0.000 MMX per 1000 inst
float scalar         141197153      # 0.002 scalar per 1000 inst
Intel metrics
elapsed              6757.530
on_cpu               0.785          # 12.56 / 16 cores
utime                53318.572
stime                31555.783
nvcsw                2058548634     # 26.09%
nivcsw               5832029530     # 73.91%
inblock              637688         # 94.37/sec
onblock              13248472       # 1960.55/sec
cpu-clock            85035232641948 # 85035.233 seconds
task-clock           85064973177120 # 85064.973 seconds
page faults          371711301      # 4369.734/sec
context switches     7887342199     # 92721.386/sec
cpu migrations       68032834       # 799.775/sec
major page faults    12513          # 0.147/sec
minor page faults    361797738      # 4253.193/sec
alignment faults     0              # 0.000/sec
emulation faults     0              # 0.000/sec
branches             46012903714132 # 129.178 branches per 1000 inst
branch misses        283085258308   # 0.62% branch miss
conditional          46013293141460 # 129.180 conditional branches per 1000 inst
indirect             14151704748033 # 39.730 indirect branches per 1000 inst
slots                517436504170508 #
retiring             227053908476335 # 43.9% (43.9%)
-- ucode             27953978000842 #     5.4%
-- fastpath          199099930475493 #    38.5%
frontend             133851851528919 # 25.9% (25.9%)
-- latency           66874983273868 #    12.9%
-- bandwidth         66976868255051 #    12.9%
backend              141357582855630 # 27.3% (27.3%)
-- cpu               29262841118363 #     5.7%
-- memory            112094741737267 #    21.7%
speculation          14979447431469 #  2.9% ( 2.9%)
-- branch mispredict 13354893130669 #     2.6%
-- pipeline restart  1624554300800  #     0.3%
smt-contention       0              #  0.0% ( 0.0%)
cpu-cycles           194962391661297 # 1.65 GHz
instructions         292457779985404 # 1.50 IPC
l2 access            4054293120327  # 17.627 l2 access per 1000 inst
l2 miss              729690506741   # 18.00% l2 miss
Process summary, dies after 23 tests, there are more than five million processes forked – so this is also a good stress test for the tools.