
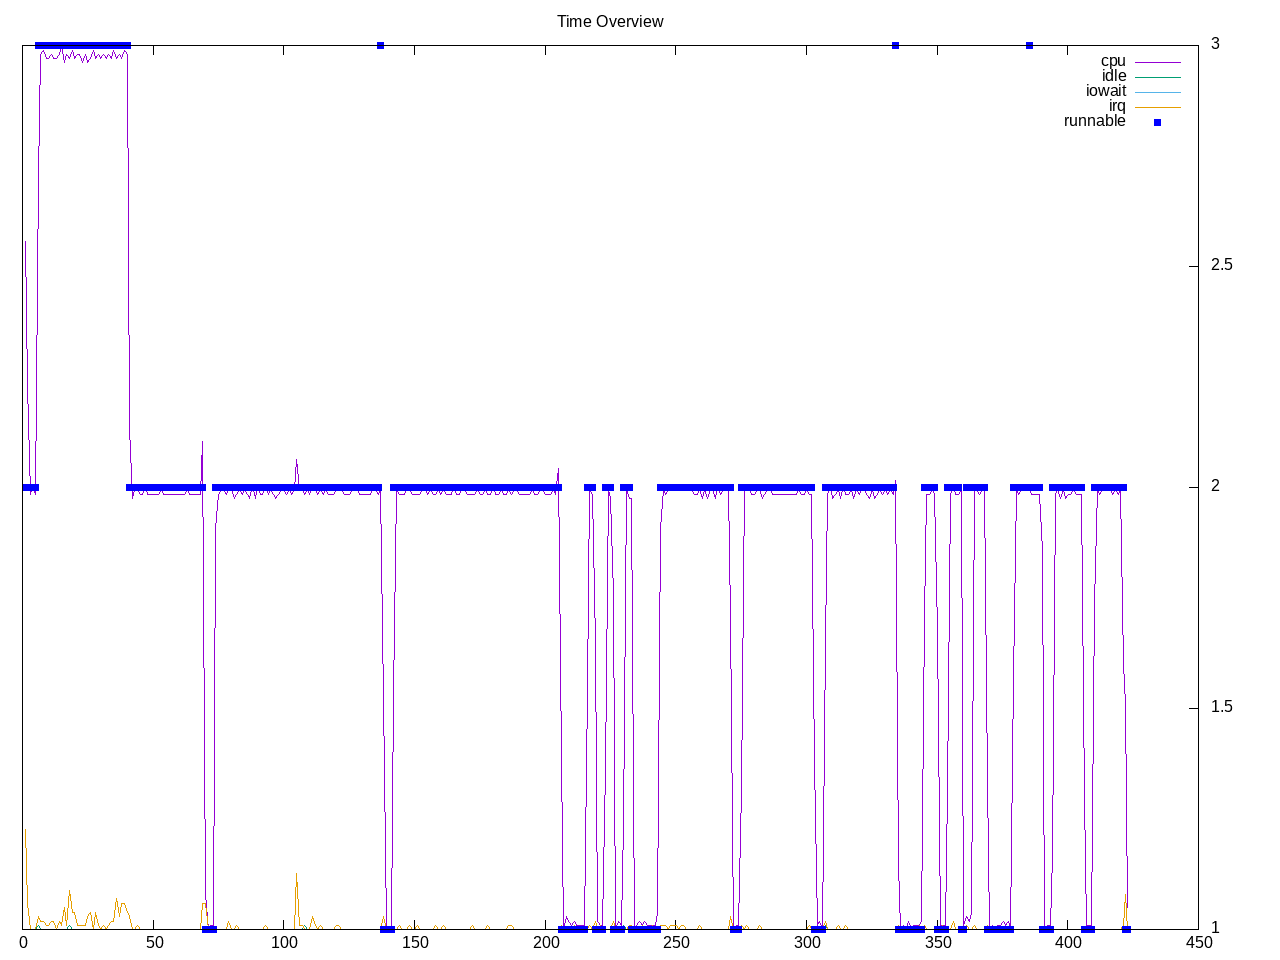
3D CAD modeler program. There are five different workloads. From the profile, these look to be single-threaded with something extra running during the first workload. The relative times also stand out with first workload taking almost as much time as the other four combined.
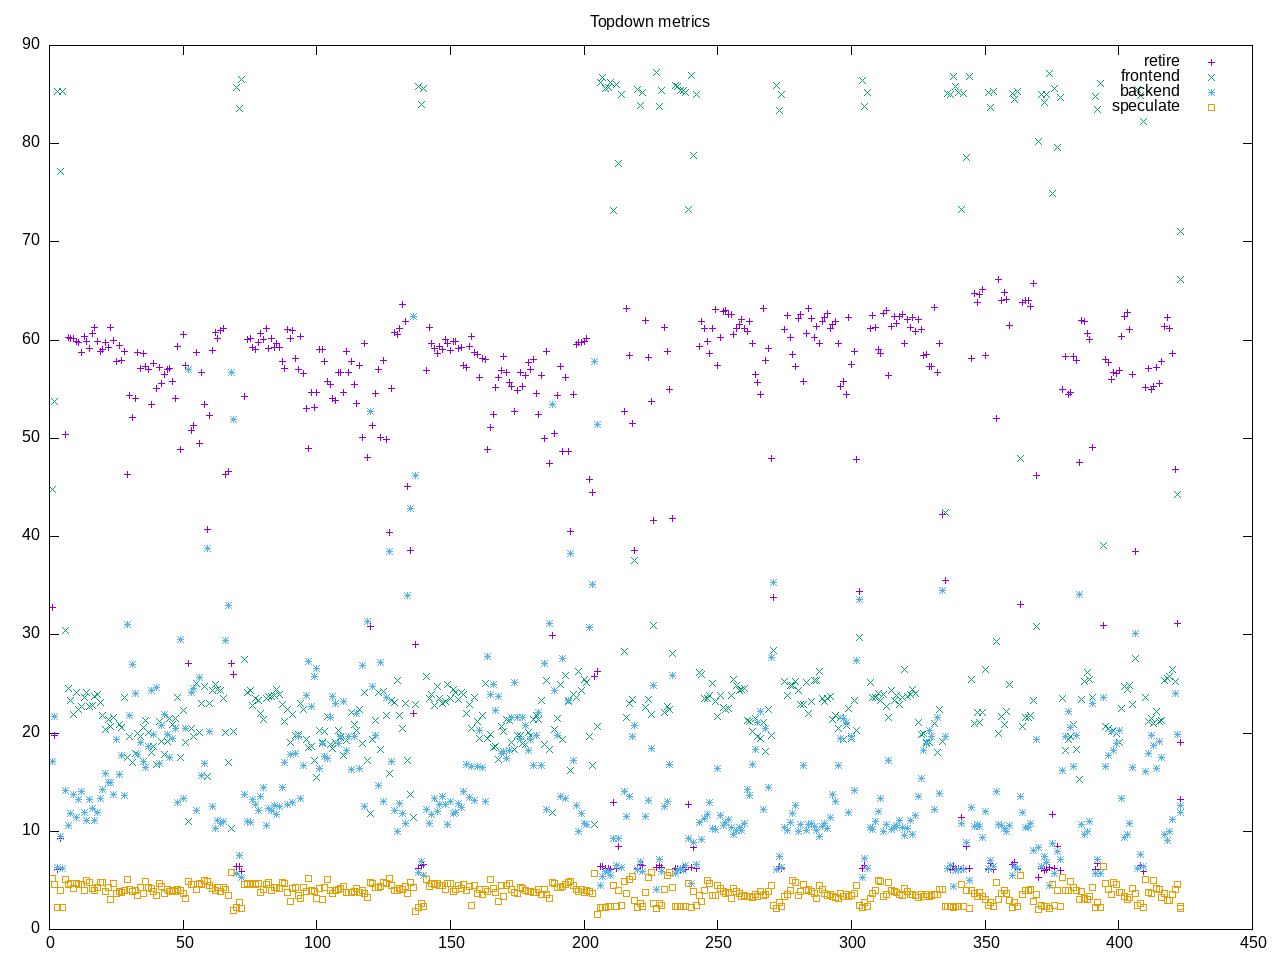
Topdown profile shows a high retirement rate and mix of backend and frontend stalls.
AMD metrics reflect a low on-core percentage, ~1/5 instructions are branches and very little floating point.
elapsed              422.749
on_cpu               0.050          # 0.80 / 16 cores
utime                332.058
stime                4.627
nvcsw                23009          # 92.58%
nivcsw               1844           # 7.42%
inblock              264            # 0.62/sec
onblock              14608          # 34.55/sec
cpu-clock            336740720119   # 336.741 seconds
task-clock           336754926269   # 336.755 seconds
page faults          1910499        # 5673.262/sec
context switches     26752          # 79.441/sec
cpu migrations       638            # 1.895/sec
major page faults    4              # 0.012/sec
minor page faults    1910495        # 5673.250/sec
alignment faults     0              # 0.000/sec
emulation faults     0              # 0.000/sec
branches             1031901503702  # 195.758 branches per 1000 inst
branch misses        4885209147     # 0.47% branch miss
conditional          681508801840   # 129.287 conditional branches per 1000 inst
indirect             68784371657    # 13.049 indirect branches per 1000 inst
cpu-cycles           1547029539906  # 0.23 GHz
instructions         5265953090888  # 3.40 IPC
slots                3098409161730  #
retiring             1761428833226  # 56.8% (56.9%)
-- ucode             3746874236     #     0.1%
-- fastpath          1757681958990  #    56.7%
frontend             676634274863   # 21.8% (21.8%)
-- latency           350628159138   #    11.3%
-- bandwidth         326006115725   #    10.5%
backend              535081034943   # 17.3% (17.3%)
-- cpu               77646362712    #     2.5%
-- memory            457434672231   #    14.8%
speculation          124848917485   #  4.0% ( 4.0%)
-- branch mispredict 119125690073   #     3.8%
-- pipeline restart  5723227412     #     0.2%
smt-contention       415746112      #  0.0% ( 0.0%)
cpu-cycles           1837831312838  # 0.21 GHz
instructions         6327727125019  # 3.44 IPC
instructions         2111272455778  # 5.506 l2 access per 1000 inst
l2 hit from l1       10450947730    # 12.78% l2 miss
l2 miss from l1      878626140      #
l2 hit from l2 pf    565877018      #
l3 hit from l2 pf    424006556      #
l3 miss from l2 pf   183262736      #
instructions         2111120557854  # 4.827 float per 1000 inst
float 512            89             # 0.000 AVX-512 per 1000 inst
float 256            590            # 0.000 AVX-256 per 1000 inst
float 128            10190850857    # 4.827 AVX-128 per 1000 inst
float MMX            0              # 0.000 MMX per 1000 inst
float scalar         1              # 0.000 scalar per 1000 inst
Intel metrics
elapsed              484.067
on_cpu               0.051          # 0.82 / 16 cores
utime                393.998
stime                3.122
nvcsw                8520           # 78.47%
nivcsw               2337           # 21.53%
inblock              66600          # 137.58/sec
onblock              3424           # 7.07/sec
cpu-clock            397153907639   # 397.154 seconds
task-clock           397165603053   # 397.166 seconds
page faults          1847986        # 4652.936/sec
context switches     13066          # 32.898/sec
cpu migrations       526            # 1.324/sec
major page faults    453            # 1.141/sec
minor page faults    1847533        # 4651.795/sec
alignment faults     0              # 0.000/sec
emulation faults     0              # 0.000/sec
branches             1031007465039  # 195.753 branches per 1000 inst
branch misses        4322959209     # 0.42% branch miss
conditional          1031007485583  # 195.753 conditional branches per 1000 inst
indirect             68768741049    # 13.057 indirect branches per 1000 inst
slots                8979723509168  #
retiring             5073544138778  # 56.5% (56.5%)
-- ucode             293115212521   #     3.3%
-- fastpath          4780428926257  #    53.2%
frontend             2583017982853  # 28.8% (28.8%)
-- latency           1148193498713  #    12.8%
-- bandwidth         1434824484140  #    16.0%
backend              738150744894   #  8.2% ( 8.2%)
-- cpu               365619503836   #     4.1%
-- memory            372531241058   #     4.1%
speculation          747395099127   #  8.3% ( 8.3%)
-- branch mispredict 669939473186   #     7.5%
-- pipeline restart  77455625941    #     0.9%
smt-contention       0              #  0.0% ( 0.0%)
cpu-cycles           1496122737534  # 0.19 GHz
instructions         5266572245280  # 3.52 IPC
l2 access            31350249974    # 5.953 l2 access per 1000 inst
l2 miss              7792586637     # 24.86% l2 miss
Process overview gives processes logical names like disk.
490 processes
	 45 openscad               330.67     3.16
	 15 openscad:cs0           330.63     3.16
	 15 opensca:disk$0         330.62     3.16
	 15 openscad:sh0           330.62     3.16
	 15 openscad:gdrv0         330.61     3.16
	 15 openscad:gl0           330.61     3.16
	 15 openscad:shlo0         330.61     3.16
	 68 clinfo                  16.56     6.40
	  2 openscad:sh1            16.36     0.24
	 38 vulkaninfo               1.33     0.92
	  6 glxinfo:gdrv0            0.17     0.02
	  6 glxinfo:gl0              0.17     0.02
	  4 vulkani:disk$0           0.14     0.09
	  6 php                      0.09     0.17
	  2 llvmpipe-0               0.07     0.05
	  2 llvmpipe-1               0.07     0.05
	  2 llvmpipe-10              0.07     0.05
	  2 llvmpipe-11              0.07     0.05
	  2 llvmpipe-12              0.07     0.05
	  2 llvmpipe-13              0.07     0.05
	  2 llvmpipe-14              0.07     0.05
	  2 llvmpipe-15              0.07     0.05
	  2 llvmpipe-2               0.07     0.05
	  2 llvmpipe-3               0.07     0.05
	  2 llvmpipe-4               0.07     0.05
	  2 llvmpipe-5               0.07     0.05
	  2 llvmpipe-6               0.07     0.05
	  2 llvmpipe-7               0.07     0.05
	  2 llvmpipe-8               0.07     0.05
	  2 llvmpipe-9               0.07     0.05
	  2 glxinfo                  0.07     0.02
	  2 glxinfo:cs0              0.07     0.02
	  2 glxinfo:disk$0           0.07     0.02
	  2 glxinfo:sh0              0.07     0.02
	  2 glxinfo:shlo0            0.07     0.02
	  6 clang                    0.06     0.06
	  3 rocminfo                 0.03     0.00
	  1 lspci                    0.00     0.02
	  1 ps                       0.00     0.01
	 89 sh                       0.00     0.00
	 12 gcc                      0.00     0.00
	  8 gsettings                0.00     0.00
	  8 stat                     0.00     0.00
	  8 systemd-detect-          0.00     0.00
	  6 llvm-link                0.00     0.00
	  5 gmain                    0.00     0.00
	  5 phoronix-test-s          0.00     0.00
	  3 dconf worker             0.00     0.00
	  2 lscpu                    0.00     0.00
	  2 uname                    0.00     0.00
	  2 which                    0.00     0.00
	  2 xset                     0.00     0.00
	  1 cc                       0.00     0.00
	  1 date                     0.00     0.00
	  1 dirname                  0.00     0.00
	  1 dmesg                    0.00     0.00
	  1 dmidecode                0.00     0.00
	  1 grep                     0.00     0.00
	  1 ifconfig                 0.00     0.00
	  1 ip                       0.00     0.00
	  1 lsmod                    0.00     0.00
	  1 mktemp                   0.00     0.00
	  1 qdbus                    0.00     0.00
	  1 readlink                 0.00     0.00
	  1 realpath                 0.00     0.00
	  1 sed                      0.00     0.00
	  1 sort                     0.00     0.00
	  1 stty                     0.00     0.00
	  1 systemctl                0.00     0.00
	  1 template.sh              0.00     0.00
	  1 wc                       0.00     0.00
	  1 xrandr                   0.00     0.00
0 processes running
47 maximum processes
The compute structure looks like a parent process opens various functional processes on different cores.
      632441) openscad         cpu=7 start=5.45  finish=69.37
        632442) openscad         cpu=11 start=5.46  finish=69.28
          632444) openscad:cs0     cpu=13 start=68.59 finish=69.28
          632445) opensca:disk$0   cpu=7 start=68.59 finish=69.28
          632446) openscad:sh0     cpu=15 start=68.59 finish=69.28
          632447) openscad:shlo0   cpu=9 start=68.59 finish=69.28
          632448) openscad:gdrv0   cpu=10 start=68.60 finish=69.27
          632449) openscad:gl0     cpu=2 start=68.60 finish=69.27
        632453) openscad         cpu=13 start=69.36 finish=69.37