
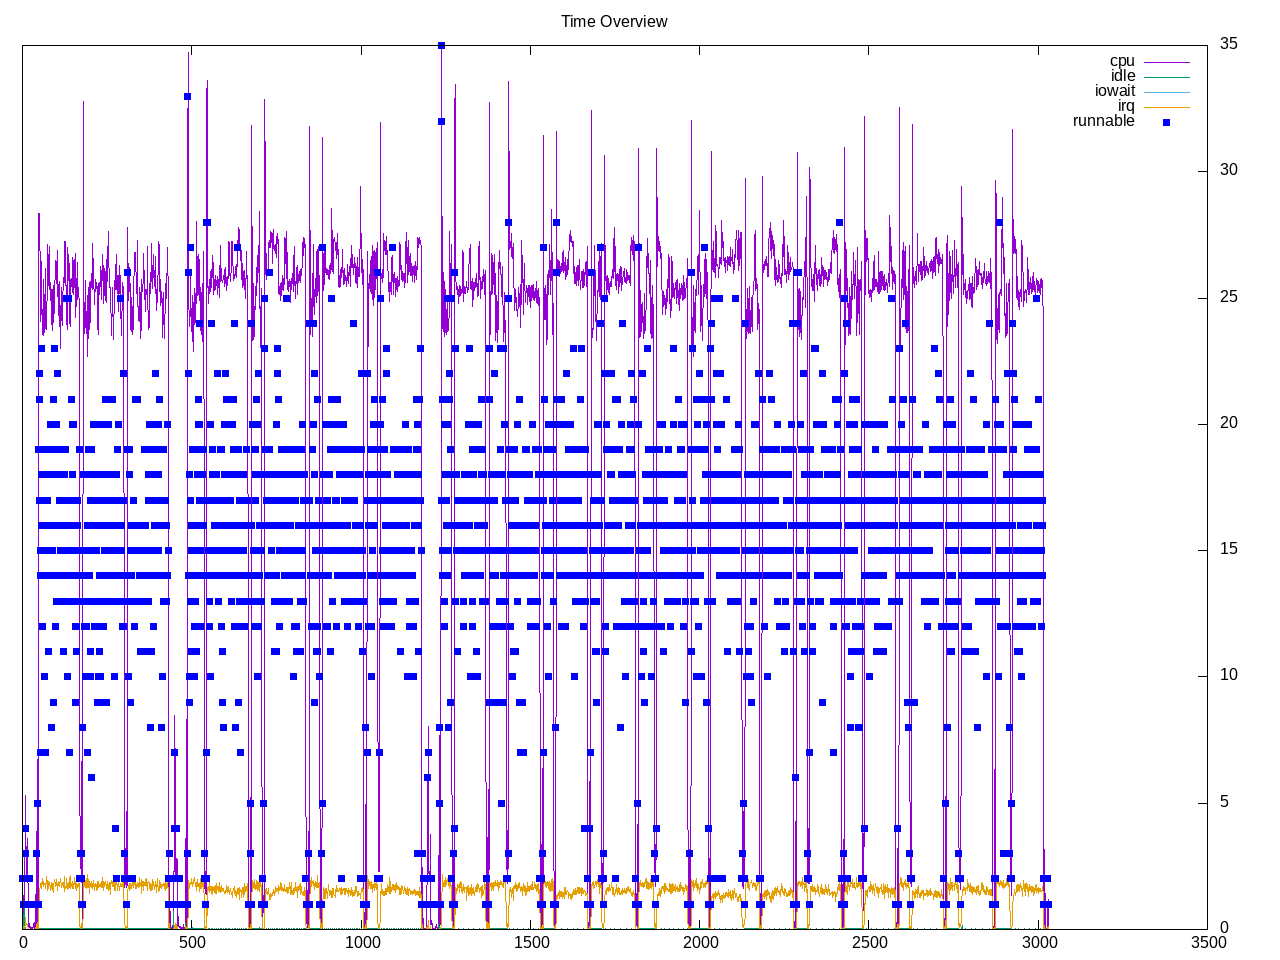
A benchmark of the Apache Cassandra NoSQL database. There are three workloads. First writes, then read/write in ratio 1:1 and then a ratio of 3:1. Looks like a variable set of runnable processes.
Topdown profile is weighted towards frontend stalls. After that some backend memory stalls with overall retirement rate lower than average.
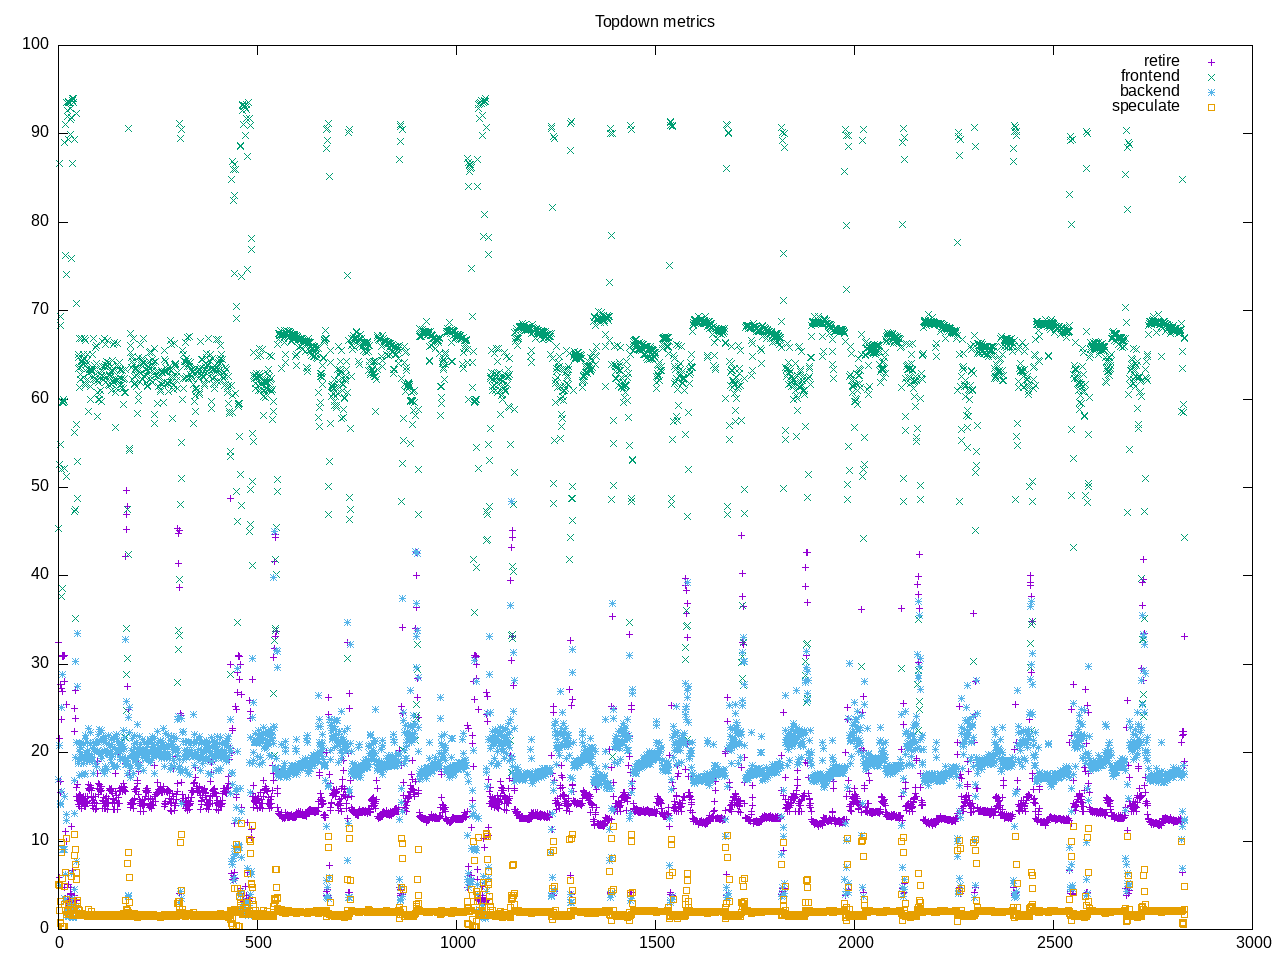
AMD metrics show not much floating point, a high amount of L2 access including misses and frontend latency almost half the total.Also interesting that only about 1/4 of the cores busy.
elapsed              4332.928
on_cpu               0.258          # 4.13 / 16 cores
utime                8905.936
stime                8995.891
nvcsw                601776779      # 94.13%
nivcsw               37510851       # 5.87%
inblock              9152           # 2.11/sec
onblock              294672         # 68.01/sec
cpu-clock            46605354321724 # 46605.354 seconds
task-clock           47003106395359 # 47003.106 seconds
page faults          35135335       # 747.511/sec
context switches     1432379568     # 30474.147/sec
cpu migrations       836923710      # 17805.711/sec
major page faults    5111418        # 108.746/sec
minor page faults    29976133       # 637.748/sec
alignment faults     0              # 0.000/sec
emulation faults     0              # 0.000/sec
branches             19677696605382 # 169.462 branches per 1000 inst
branch misses        1174720045057  # 5.97% branch miss
conditional          14157392473496 # 121.922 conditional branches per 1000 inst
indirect             398569475290   # 3.432 indirect branches per 1000 inst
cpu-cycles           110019767419271 # 2.46 GHz
instructions         78514350926593 # 0.71 IPC
slots                215057315796582 #
retiring             26727298203613 # 12.4% (14.0%)
-- ucode             107310119389   #     0.0%
-- fastpath          26619988084224 #    12.4%
frontend             121877473591996 # 56.7% (64.0%)
-- latency           105576764308332 #    49.1%
-- bandwidth         16300709283664 #     7.6%
backend              37980810293573 # 17.7% (19.9%)
-- cpu               3183460600102  #     1.5%
-- memory            34797349693471 #    16.2%
speculation          3728650165352  #  1.7% ( 2.0%)
-- branch mispredict 3700122721449  #     1.7%
-- pipeline restart  28527443903    #     0.0%
smt-contention       24641343322125 # 11.5% ( 0.0%)
cpu-cycles           118359556086527 # 2.48 GHz
instructions         83709827177511 # 0.71 IPC
instructions         27330974978530 # 104.378 l2 access per 1000 inst
l2 hit from l1       2521875844280  # 40.19% l2 miss
l2 miss from l1      913841730923   #
l2 hit from l2 pf    98215015831    #
l3 hit from l2 pf    193261277895   #
l3 miss from l2 pf   39386943790    #
instructions         27344544465946 # 8.199 float per 1000 inst
float 512            308            # 0.000 AVX-512 per 1000 inst
float 256            962            # 0.000 AVX-256 per 1000 inst
float 128            224187156471   # 8.199 AVX-128 per 1000 inst
float MMX            0              # 0.000 MMX per 1000 inst
float scalar         33788          # 0.000 scalar per 1000 inst
Intel metrics
elapsed              4097.853
on_cpu               0.265          # 4.24 / 16 cores
utime                10573.212
stime                6785.551
nvcsw                549845910      # 94.17%
nivcsw               34034739       # 5.83%
inblock              1175312        # 286.81/sec
onblock              255152         # 62.26/sec
cpu-clock            46773863724106 # 46773.864 seconds
task-clock           47010972033464 # 47010.972 seconds
page faults          28928282       # 615.352/sec
context switches     1341725858     # 28540.696/sec
cpu migrations       871346665      # 18534.964/sec
major page faults    3548986        # 75.493/sec
minor page faults    25312394       # 538.436/sec
alignment faults     0              # 0.000/sec
emulation faults     0              # 0.000/sec
branches             17578871409480 # 162.943 branches per 1000 inst
branch misses        285816420521   # 1.63% branch miss
conditional          17578871753096 # 162.943 conditional branches per 1000 inst
indirect             3475864234757  # 32.219 indirect branches per 1000 inst
slots                260335397251850 #
retiring             80256736492957 # 30.8% (30.8%)
-- ucode             6584405418875  #     2.5%
-- fastpath          73672331074082 #    28.3%
frontend             90294915158826 # 34.7% (34.7%)
-- latency           59016419380680 #    22.7%
-- bandwidth         31278495778146 #    12.0%
backend              61537137199156 # 23.6% (23.6%)
-- cpu               23158639207958 #     8.9%
-- memory            38378497991198 #    14.7%
speculation          30134034973779 # 11.6% (11.6%)
-- branch mispredict 28831919130365 #    11.1%
-- pipeline restart  1302115843414  #     0.5%
smt-contention       0              #  0.0% ( 0.0%)
cpu-cycles           166264750189585 # 2.23 GHz
instructions         157451768214939 # 0.95 IPC
l2 access            7724180485399  # 103.319 l2 access per 1000 inst
l2 miss              3266744587191  # 42.29% l2 miss
Interesting set of process names being used. This is a JDK program and many existing processes seem to run throughout the benchmark. We lost some events at the end.
9103 processes
	 85 JMX server conn      1369594.41     0.00
	 25 RMI TCP Connect      489389.80     0.00
	 64 epollEventLoopG      313049.92 140784.96
	1184 cluster1-nio-wo      260370.83 215330.45
	 38 Native-Transpor      188366.70 85160.72
	  4 RMI TCP Accept-      133587.60     0.00
	 23 MemtableFlushWr      93993.37 36670.56
	 23 PerDiskMemtable      93988.87 36668.69
	 87 VM Periodic Tas      66793.80     0.00
	  2 CMS Main Thread      66793.80     0.00
	  8 MutationStage-2      39131.24 17598.12
	174 java                 35845.62 22259.47
	  5 MutationStage-1      23210.37 10214.00
	  7 CompactionExecu      22095.39  9798.23
	 96 globalEventExec      21541.15 17823.12
	  4 LocalPool-Clean      19565.62  8799.06
	 87 Finalizer            17922.81 11129.74
	 42 Common-Cleaner       17921.81 11129.00
	  2 AsyncAppender-W       9782.81  4399.53
	  2 BatchlogTasks:1       9782.81  4399.53
	  2 COMMIT-LOG-ALLO       9782.81  4399.53
	  2 Callback-Map-Re       9782.81  4399.53
	  2 ForkJoinPool.co       9782.81  4399.53
	  2 GossipTasks:1         9782.81  4399.53
	  2 HintsWriteExecu       9782.81  4399.53
	  2 IndexSummaryMan       9782.81  4399.53
	  2 MemtablePostFlu       9782.81  4399.53
	  2 MemtableReclaim       9782.81  4399.53
	  2 Messaging-Accep       9782.81  4399.53
	  2 MigrationStage:       9782.81  4399.53
	  2 NonPeriodicTask       9782.81  4399.53
	  2 OptionalTasks:1       9782.81  4399.53
	  2 PERIODIC-COMMIT       9782.81  4399.53
	  2 PendingRangeCal       9782.81  4399.53
	  2 Reference-Reape       9782.81  4399.53
	  2 ScheduledFastTa       9782.81  4399.53
	  2 ScheduledTasks:       9782.81  4399.53
	  2 SecondaryIndexM       9782.81  4399.53
	  2 SlabPoolCleaner       9782.81  4399.53
	  2 SnapshotCleanup       9782.81  4399.53
	  2 logback-1             9782.81  4399.53
	  2 logback-2             9782.81  4399.53
	  2 logback-3             9782.81  4399.53
	  2 logback-4             9782.81  4399.53
	  2 logback-5             9782.81  4399.53
	  2 logback-6             9782.81  4399.53
	  2 logback-7             9782.81  4399.53
	  2 logback-8             9782.81  4399.53
	  2 read-hotness-tr       9782.81  4399.53
	 89 StressMetrics         8901.83  6859.15
	 37 ObjectCleanerTh       8136.82  6729.24
	 37 JmxCollector:1        8136.80  6729.23
	 37 JmxCollector:10       8136.80  6729.23
	 37 JmxCollector:11       8136.80  6729.23
	 37 JmxCollector:12       8136.80  6729.23
	 37 JmxCollector:13       8136.80  6729.23
	 37 JmxCollector:14       8136.80  6729.23
	 37 JmxCollector:15       8136.80  6729.23
	 37 JmxCollector:16       8136.80  6729.23
	 37 JmxCollector:2        8136.80  6729.23
	 37 JmxCollector:3        8136.80  6729.23
	 37 JmxCollector:4        8136.80  6729.23
	 37 JmxCollector:5        8136.80  6729.23
	 37 JmxCollector:6        8136.80  6729.23
	 37 JmxCollector:7        8136.80  6729.23
	 37 JmxCollector:8        8136.80  6729.23
	 37 JmxCollector:9        8136.80  6729.23
	 37 Logging-Cleaner       8136.70  6729.17
	 37 Thread-0              8136.67  6729.17
	 37 Shutdown-checke       8136.66  6729.14
	 37 cluster1-connec       8136.66  6729.14
	 37 cluster1-timeou       8136.65  6729.14
	 37 cluster1-schedu       8132.43  6728.24
	  1 MutationStage-4       6138.06  2984.59
	 70 cluster1-worker       6065.67  4522.42
	 38 Thread-21             5089.49  4092.63
	 38 Thread-22             5089.49  4092.62
	 38 Thread-25             5089.47  4092.63
	 38 Thread-28             5089.47  4092.63
	 38 Thread-32             5089.47  4092.63
	 38 Thread-34             5089.47  4092.63
	 38 Thread-20             5089.47  4092.62
	 38 Thread-35             5089.46  4092.63
	 38 Thread-23             5089.46  4092.62
	 38 Thread-24             5089.46  4092.62
	 38 Thread-26             5089.45  4092.62
	 38 Thread-27             5089.45  4092.62
	 38 Thread-29             5089.45  4092.62
	 38 Thread-31             5089.45  4092.62
	 38 Thread-33             5089.45  4092.62
	 38 Thread-30             5089.44  4092.62
	  1 ReadStage-10          3644.75  1414.94
	  1 ReadStage-18          3644.75  1414.94
	  1 ReadStage-19          3644.75  1414.94
	  1 ReadStage-20          3644.75  1414.94
	  1 ReadStage-25          3644.75  1414.94
	  1 ReadStage-31          3644.75  1414.94
	  1 ReadStage-4           3644.75  1414.94
	 13 Thread-37             3287.03  2684.24
	 13 Thread-39             3287.03  2684.24
	 13 Thread-40             3287.03  2684.24
	 13 Thread-41             3287.03  2684.24
	 13 Thread-42             3287.03  2684.24
	 13 Thread-44             3287.03  2684.24
	 13 Thread-46             3287.03  2684.24
	 13 Thread-47             3287.03  2684.24
	 13 Thread-48             3287.03  2684.24
	 13 Thread-51             3287.03  2684.24
	 13 Thread-52             3287.03  2684.24
	 13 Thread-43             3287.03  2684.23
	 13 Thread-45             3287.03  2684.23
	 13 Thread-49             3287.03  2684.23
	 13 Thread-38             3287.02  2684.24
	 13 Thread-50             3287.02  2684.24
	 38 Thread-4               523.50    82.11
	 38 Thread-3               523.49    82.12
	 38 Thread-6               523.49    82.11
	 38 Thread-10              523.48    82.12
	 38 Thread-5               523.48    82.11
	 38 Thread-7               523.47    82.12
	 38 Thread-9               523.46    82.11
	 38 Thread-12              523.44    82.12
	 38 Thread-8               523.44    82.11
	 38 Thread-11              523.43    82.11
	 38 Thread-14              523.43    82.10
	 38 Thread-16              523.43    82.10
	 38 Thread-17              523.43    82.10
	 38 Thread-13              523.42    82.11
	 38 Thread-18              523.42    82.10
	 38 Thread-15              523.41    82.11
	  9 loadSavedCache:         51.25    25.02
	 31 clinfo                   8.41     3.63
	 19 vulkaninfo               0.73     0.76
	  3 find                     0.36     0.48
	  3 glxinfo:gdrv0            0.08     0.03
	  3 glxinfo:gl0              0.08     0.03
	  6 ldconfig.real            0.07     0.15
	  2 vulkani:disk$0           0.07     0.08
	  6 clang                    0.06     0.06
	  1 llvmpipe-0               0.04     0.04
	  1 llvmpipe-1               0.04     0.04
	  1 llvmpipe-10              0.04     0.04
	  1 llvmpipe-11              0.04     0.04
	  1 llvmpipe-12              0.04     0.04
	  1 llvmpipe-13              0.04     0.04
	  1 llvmpipe-14              0.04     0.04
	  1 llvmpipe-15              0.04     0.04
	  1 llvmpipe-2               0.04     0.04
	  1 llvmpipe-3               0.04     0.04
	  1 llvmpipe-4               0.04     0.04
	  1 llvmpipe-5               0.04     0.04
	  1 llvmpipe-6               0.04     0.04
	  1 llvmpipe-7               0.04     0.04
	  1 llvmpipe-8               0.04     0.04
	  1 llvmpipe-9               0.04     0.04
	  1 glxinfo                  0.04     0.01
	  1 glxinfo:cs0              0.04     0.01
	  1 glxinfo:disk$0           0.04     0.01
	  1 glxinfo:sh0              0.04     0.01
	  1 glxinfo:shlo0            0.04     0.01
	518 C1 CompilerThre          0.00 307397.68
	890 C2 CompilerThre          0.00 218273.37
	 87 GC Thread#0              0.00 17922.81
	 87 Reference Handl          0.00 17922.81
	 87 Service Thread           0.00 17922.81
	 87 Signal Dispatch          0.00 17922.81
	 87 VM Thread                0.00 17922.81
	 87 Sweeper thread           0.00 17922.80
	 42 GC Thread#1              0.00 17921.81
	 42 GC Thread#2              0.00 17921.81
	 42 GC Thread#3              0.00 17921.81
	 42 GC Thread#4              0.00 17921.81
	 42 GC Thread#5              0.00 17921.81
	 42 GC Thread#6              0.00 17921.81
	 42 GC Thread#7              0.00 17921.81
	 42 GC Thread#8              0.00 17921.81
	 42 GC Thread#9              0.00 17921.81
	 39 RMI Scheduler(0          0.00 17919.62
	 39 GC Thread#10             0.00 17919.61
	 39 GC Thread#11             0.00 17919.61
	 39 GC Thread#12             0.00 17919.61
	  2 CMS Thread#0             0.00  9782.81
	  2 CMS Thread#1             0.00  9782.81
	  2 CMS Thread#2             0.00  9782.81
	  2 CMS Thread#3             0.00  9782.81
	 85 G1 Conc#0                0.00  8140.00
	 85 G1 Refine#0              0.00  8139.88
	 37 G1 Conc#1                0.00  8136.82
	 37 G1 Conc#2                0.00  8136.82
	 37 RMI RenewClean-          0.00  8136.80
	 33 G1 Refine#1              0.00  7264.24
	 27 G1 Refine#2              0.00  5765.48
	  3 process reaper           0.00   373.36
	  1 G1 Refine#3              0.00   317.12
	  5 rm                       0.00     1.25
	113 cassandra                0.00     0.02
	327 cassandra-stres          0.00     0.00
	228 grep                     0.00     0.00
	135 awk                      0.00     0.00
	 89 dirname                  0.00     0.00
	 87 JMX client hear          0.00     0.00
	 85 G1 Main Marker           0.00     0.00
	 85 G1 Young RemSet          0.00     0.00
	 67 sh                       0.00     0.00
	 44 cut                      0.00     0.00
	 37 RMI GC Daemon            0.00     0.00
	 29 cat                      0.00     0.00
	 19 sleep                    0.00     0.00
	 12 expr                     0.00     0.00
	 12 gcc                      0.00     0.00
	  9 gsettings                0.00     0.00
	  8 systemd-detect-          0.00     0.00
	  8 which                    0.00     0.00
	  7 stat                     0.00     0.00
	  6 llvm-link                0.00     0.00
	  6 ls                       0.00     0.00
	  6 tr                       0.00     0.00
	  6 uname                    0.00     0.00
	  5 bash                     0.00     0.00
	  4 gmain                    0.00     0.00
	  4 phoronix-test-s          0.00     0.00
	  4 sed                      0.00     0.00
	  4 sort                     0.00     0.00
	  3 free                     0.00     0.00
	  3 getopt                   0.00     0.00
	  3 head                     0.00     0.00
	  3 mkdir                    0.00     0.00
	  2 dconf worker             0.00     0.00
	  1 date                     0.00     0.00
	  1 ifconfig                 0.00     0.00
	  1 ip                       0.00     0.00
	  1 lscpu                    0.00     0.00
	  1 mktemp                   0.00     0.00
	  1 ps                       0.00     0.00
	  1 qdbus                    0.00     0.00
	  1 readlink                 0.00     0.00
	  1 realpath                 0.00     0.00
	  1 stty                     0.00     0.00
	  1 systemctl                0.00     0.00
	  1 template.sh              0.00     0.00
	  1 wc                       0.00     0.00
	  1 xrandr                   0.00     0.00
	  1 xset                     0.00     0.00
238 processes running
248 maximum processes