
Quick running test of 15 glib functions, mostly math routines and also pthread creation. These run single-threaded. This benchmark is an outlier with Intel CPU reporting ~2X faster than AMD while almost every case has AMD faster and a median of AMD as 1.25x faster than my Intel CPU
Looks like these are single-threaded tests also not using the CPU much during that time.
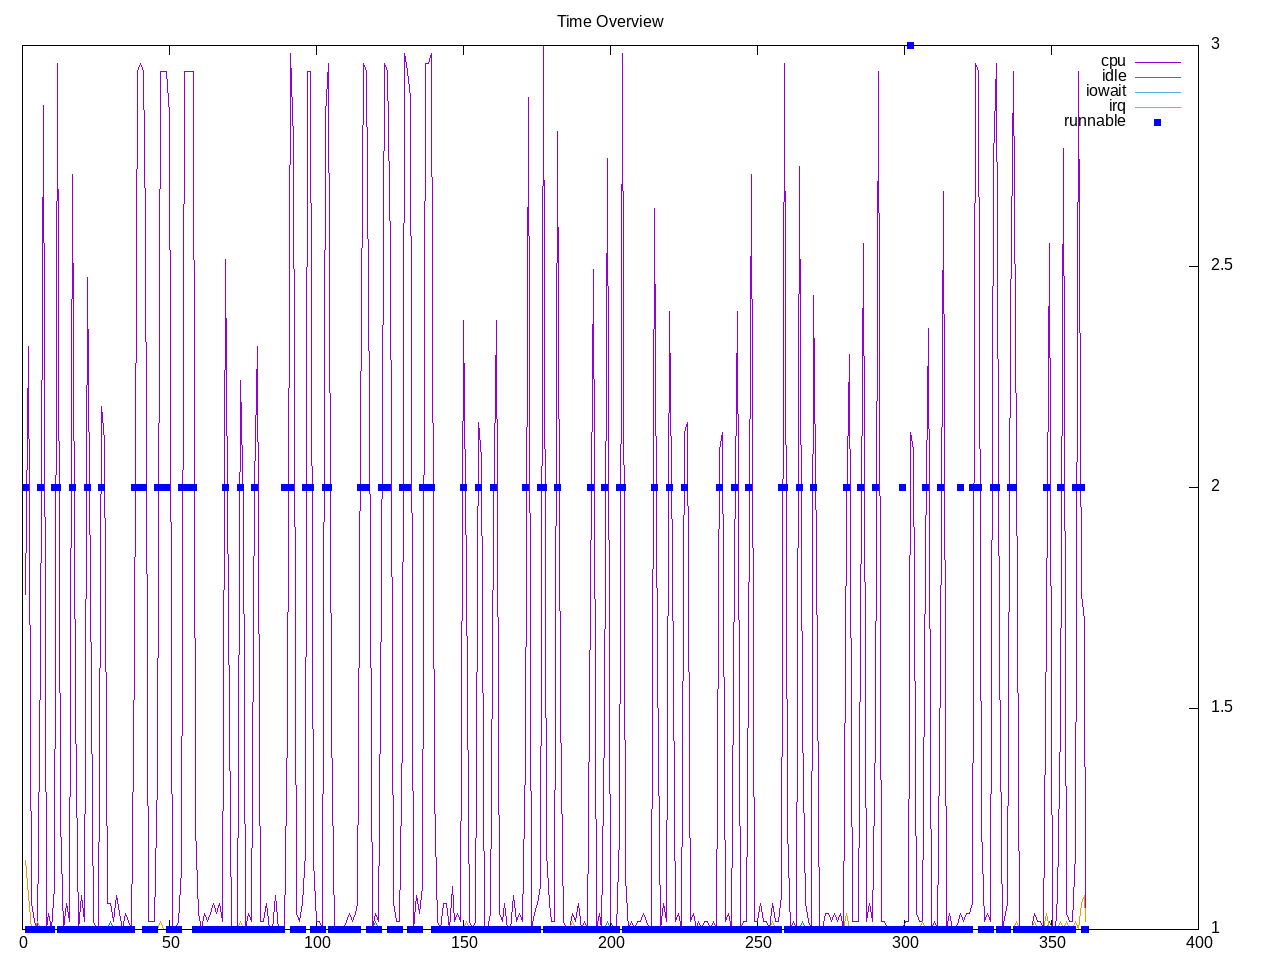
Topdown profile shows across the map but generally frontend bound is highest.
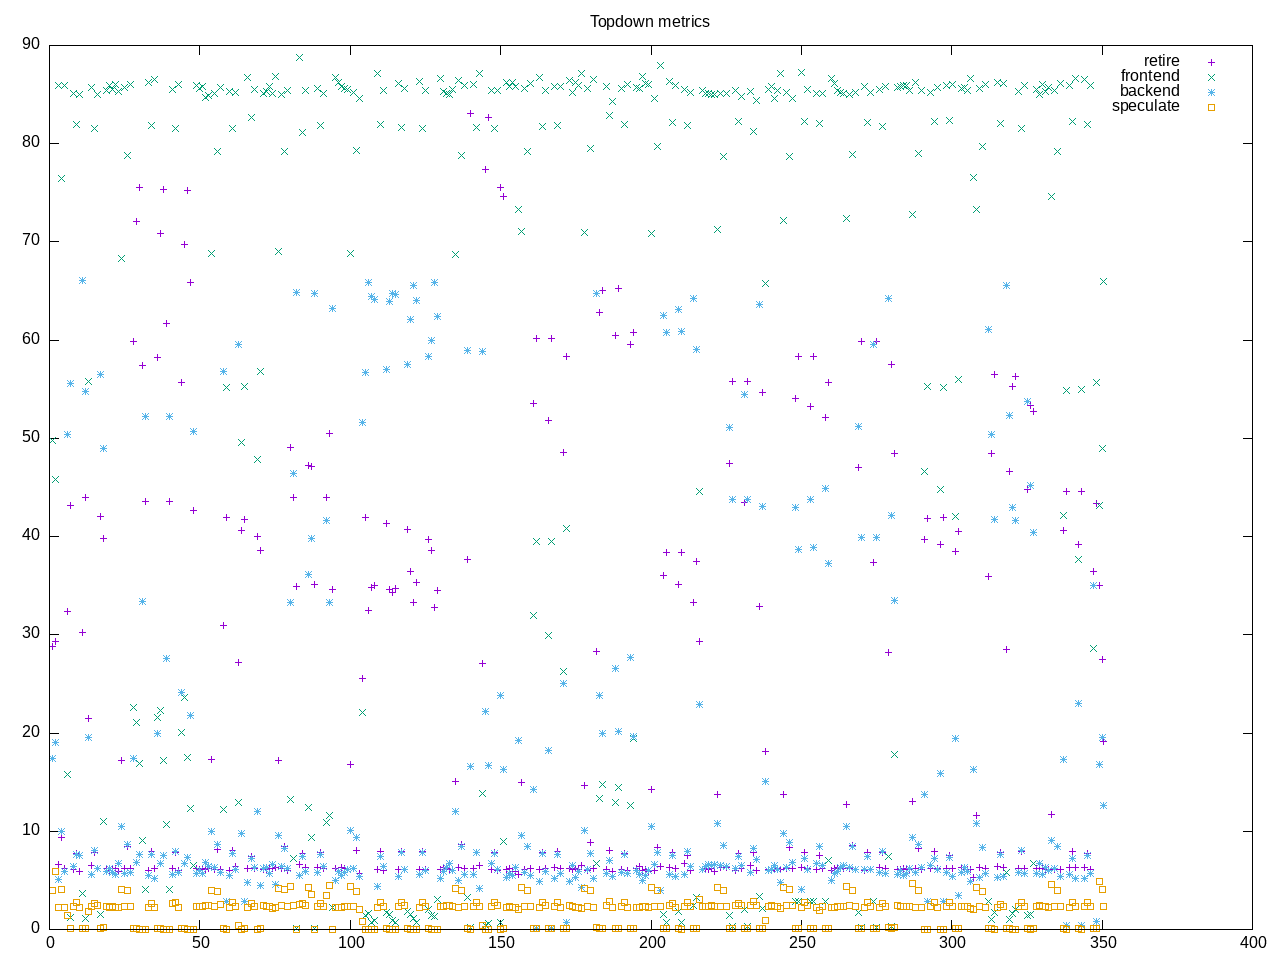
AMD metrics confirm a low on-core amount of less than 0.25. This is floating point code with 1/6 of the instructions as branches.
elapsed              361.394
on_cpu               0.014          # 0.22 / 16 cores
utime                79.680
stime                1.329
nvcsw                2624           # 86.03%
nivcsw               426            # 13.97%
inblock              0              # 0.00/sec
onblock              590512         # 1633.98/sec
cpu-clock            81084003036    # 81.084 seconds
task-clock           81091329790    # 81.091 seconds
page faults          171284         # 2112.236/sec
context switches     4566           # 56.307/sec
cpu migrations       308            # 3.798/sec
major page faults    2              # 0.025/sec
minor page faults    171282         # 2112.211/sec
alignment faults     0              # 0.000/sec
emulation faults     0              # 0.000/sec
branches             143004053928   # 168.158 branches per 1000 inst
branch misses        147238834      # 0.10% branch miss
conditional          76874647961    # 90.397 conditional branches per 1000 inst
indirect             18182592456    # 21.381 indirect branches per 1000 inst
cpu-cycles           296276857093   # 0.05 GHz
instructions         835134997575   # 2.82 IPC
slots                595808733960   #
retiring             292824575828   # 49.1% (49.2%)
-- ucode             489790524      #     0.1%
-- fastpath          292334785304   #    49.1%
frontend             75678185011    # 12.7% (12.7%)
-- latency           33401593776    #     5.6%
-- bandwidth         42276591235    #     7.1%
backend              225177966311   # 37.8% (37.8%)
-- cpu               177289153913   #    29.8%
-- memory            47888812398    #     8.0%
speculation          1976038812     #  0.3% ( 0.3%) low
-- branch mispredict 1551074100     #     0.3%
-- pipeline restart  424964712      #     0.1%
smt-contention       151682832      #  0.0% ( 0.0%)
cpu-cycles           308438408523   # 0.05 GHz
instructions         873920649612   # 2.83 IPC
instructions         291987017136   # 0.711 l2 access per 1000 inst
l2 hit from l1       186290923      # 15.32% l2 miss
l2 miss from l1      20387235       #
l2 hit from l2 pf    9865651        #
l3 hit from l2 pf    4957233        #
l3 miss from l2 pf   6466175        #
instructions         291912058167   # 241.214 float per 1000 inst
float 512            99             # 0.000 AVX-512 per 1000 inst
float 256            686            # 0.000 AVX-256 per 1000 inst
float 128            70413333814    # 241.214 AVX-128 per 1000 inst
float MMX            0              # 0.000 MMX per 1000 inst
float scalar         0              # 0.000 scalar per 1000 inst
Intel metrics
elapsed              348.282
on_cpu               0.014          # 0.23 / 16 cores
utime                78.891
stime                0.979
nvcsw                2392           # 86.26%
nivcsw               381            # 13.74%
inblock              8              # 0.02/sec
onblock              579000         # 1662.44/sec
cpu-clock            79962687901    # 79.963 seconds
task-clock           79973477567    # 79.973 seconds
page faults          159208         # 1990.760/sec
context switches     4242           # 53.043/sec
cpu migrations       348            # 4.351/sec
major page faults    0              # 0.000/sec
minor page faults    159208         # 1990.760/sec
alignment faults     0              # 0.000/sec
emulation faults     0              # 0.000/sec
branches             184610022112   # 183.279 branches per 1000 inst
branch misses        48479139       # 0.03% branch miss
conditional          184610037632   # 183.279 conditional branches per 1000 inst
indirect             24923776264    # 24.744 indirect branches per 1000 inst
slots                1796340876272  #
retiring             1014873631013  # 56.5% (56.5%) high
-- ucode             80587003382    #     4.5%
-- fastpath          934286627631   #    52.0%
frontend             48346621350    #  2.7% ( 2.7%) low
-- latency           4806798326     #     0.3%
-- bandwidth         43539823024    #     2.4%
backend              727802271913   # 40.5% (40.5%)
-- cpu               547583708462   #    30.5%
-- memory            180218563451   #    10.0%
speculation          5601582618     #  0.3% ( 0.3%) low
-- branch mispredict 5416805254     #     0.3%
-- pipeline restart  184777364      #     0.0%
smt-contention       0              #  0.0% ( 0.0%)
cpu-cycles           356432878563   # 0.05 GHz
instructions         1213906374887  # 3.41 IPC high
l2 access            416472360      # 0.343 l2 access per 1000 inst
l2 miss              129752775      # 31.16% l2 miss
Process overview shows largest proportion in the linker, ld.so and glibc-bench having zero time.
470 processes
	 47 ld.so                   76.06     0.00
	 68 clinfo                  17.19     8.32
	 38 vulkaninfo               1.51     0.76
	  4 vulkani:disk$0           0.16     0.08
	  6 php                      0.12     0.59
	  6 glxinfo:gdrv0            0.12     0.08
	  6 glxinfo:gl0              0.12     0.08
	  2 llvmpipe-0               0.08     0.04
	  2 llvmpipe-1               0.08     0.04
	  2 llvmpipe-10              0.08     0.04
	  2 llvmpipe-11              0.08     0.04
	  2 llvmpipe-12              0.08     0.04
	  2 llvmpipe-13              0.08     0.04
	  2 llvmpipe-14              0.08     0.04
	  2 llvmpipe-15              0.08     0.04
	  2 llvmpipe-2               0.08     0.04
	  2 llvmpipe-3               0.08     0.04
	  2 llvmpipe-4               0.08     0.04
	  2 llvmpipe-5               0.08     0.04
	  2 llvmpipe-6               0.08     0.04
	  2 llvmpipe-7               0.08     0.04
	  2 llvmpipe-8               0.08     0.04
	  2 llvmpipe-9               0.08     0.04
	  2 glxinfo                  0.06     0.04
	  2 glxinfo:cs0              0.06     0.04
	  2 glxinfo:disk$0           0.06     0.04
	  2 glxinfo:sh0              0.06     0.04
	  2 glxinfo:shlo0            0.06     0.04
	  6 clang                    0.05     0.07
	  3 rocminfo                 0.03     0.00
	  1 lspci                    0.00     0.03
	  1 ps                       0.00     0.01
	110 sh                       0.00     0.00
	 47 glibc-bench              0.00     0.00
	 13 gcc                      0.00     0.00
	 11 gsettings                0.00     0.00
	  8 stat                     0.00     0.00
	  8 systemd-detect-          0.00     0.00
	  6 llvm-link                0.00     0.00
	  5 phoronix-test-s          0.00     0.00
	  3 gmain                    0.00     0.00
	  2 cc                       0.00     0.00
	  2 dconf worker             0.00     0.00
	  2 lscpu                    0.00     0.00
	  2 uname                    0.00     0.00
	  2 which                    0.00     0.00
	  2 xset                     0.00     0.00
	  1 date                     0.00     0.00
	  1 dirname                  0.00     0.00
	  1 dmesg                    0.00     0.00
	  1 dmidecode                0.00     0.00
	  1 grep                     0.00     0.00
	  1 ifconfig                 0.00     0.00
	  1 ip                       0.00     0.00
	  1 lsmod                    0.00     0.00
	  1 mktemp                   0.00     0.00
	  1 qdbus                    0.00     0.00
	  1 readlink                 0.00     0.00
	  1 realpath                 0.00     0.00
	  1 sed                      0.00     0.00
	  1 sort                     0.00     0.00
	  1 stty                     0.00     0.00
	  1 systemctl                0.00     0.00
	  1 template.sh              0.00     0.00
	  1 wc                       0.00     0.00
	  1 xrandr                   0.00     0.00
0 processes running
47 maximum processes
Process overview shows the “ld.so” is the proxy for where the tests are running.
      1103623) glibc-bench      cpu=2 start=5.48  finish=6.62
        1103624) ld.so            cpu=3 start=5.48  finish=6.62
      1103625) glibc-bench      cpu=1 start=10.63 finish=11.77
        1103626) ld.so            cpu=10 start=10.63 finish=11.77
      1103629) glibc-bench      cpu=10 start=15.77 finish=16.91
        1103630) ld.so            cpu=11 start=15.77 finish=16.91
      1103631) glibc-bench      cpu=1 start=20.91 finish=22.06
        1103632) ld.so            cpu=2 start=20.92 finish=22.05
      1103633) sh               cpu=1 start=22.06 finish=22.06
        1103634) sh               cpu=11 start=22.06 finish=22.06
      1103635) glibc-bench      cpu=1 start=32.21 finish=36.35
        1103636) ld.so            cpu=10 start=32.22 finish=36.35
      1103637) glibc-bench      cpu=9 start=40.35 finish=44.48
        1103638) ld.so            cpu=10 start=40.35 finish=44.48
      1103639) glibc-bench      cpu=9 start=48.49 finish=52.62
        1103640) ld.so            cpu=2 start=48.49 finish=52.62
      1103641) sh               cpu=11 start=52.62 finish=52.63
        1103642) sh               cpu=12 start=52.62 finish=52.63
      1103643) glibc-bench      cpu=2 start=62.79 finish=63.91
        1103644) ld.so            cpu=3 start=62.79 finish=63.91
      1103645) glibc-bench      cpu=10 start=67.92 finish=69.05
        1103646) ld.so            cpu=11 start=67.92 finish=69.05
      1103647) glibc-bench      cpu=9 start=73.05 finish=74.18
        1103648) ld.so            cpu=10 start=73.05 finish=74.18
      1103650) sh               cpu=10 start=74.18 finish=74.18
        1103651) sh               cpu=3 start=74.18 finish=74.18
      1103652) glibc-bench      cpu=1 start=84.34 finish=86.49
        1103653) ld.so            cpu=10 start=84.35 finish=86.49
      1103654) glibc-bench      cpu=9 start=90.49 finish=92.64
        1103655) ld.so            cpu=10 start=90.50 finish=92.64
      1103656) glibc-bench      cpu=9 start=96.64 finish=98.78
        1103657) ld.so            cpu=10 start=96.64 finish=98.78