
The Problem Based Benchmark Suite (PBBS) is a source repository of about 20 different algorithms expressed in short benchmarks. For example:
ANN
breadthFirstSearch
BWDecode
classify
comparisonSort
concurrentKNN
convexHull
delaunayRefine
delaunayTriangulation
histogram
integerSort
invertedIndex
longestRepeatedSubstring
maximalIndependentSet
maximalMatching
minSpanningForest
nBody
nearestNeighbors
rangeQuery2d
rangeQueryKDTree
rangeSearch
rayCast
removeDuplicates
spanningForest
suffixArray
wordCounts
The benchmarks come in a small mode and large mode and have a quick implementation. The system requires 64GB of RAM for large mode, so I have run the smaller mode which only needs 12GB of RAM. However, this also results of some of them running in just seconds so I collected them together to show a conglomeration.
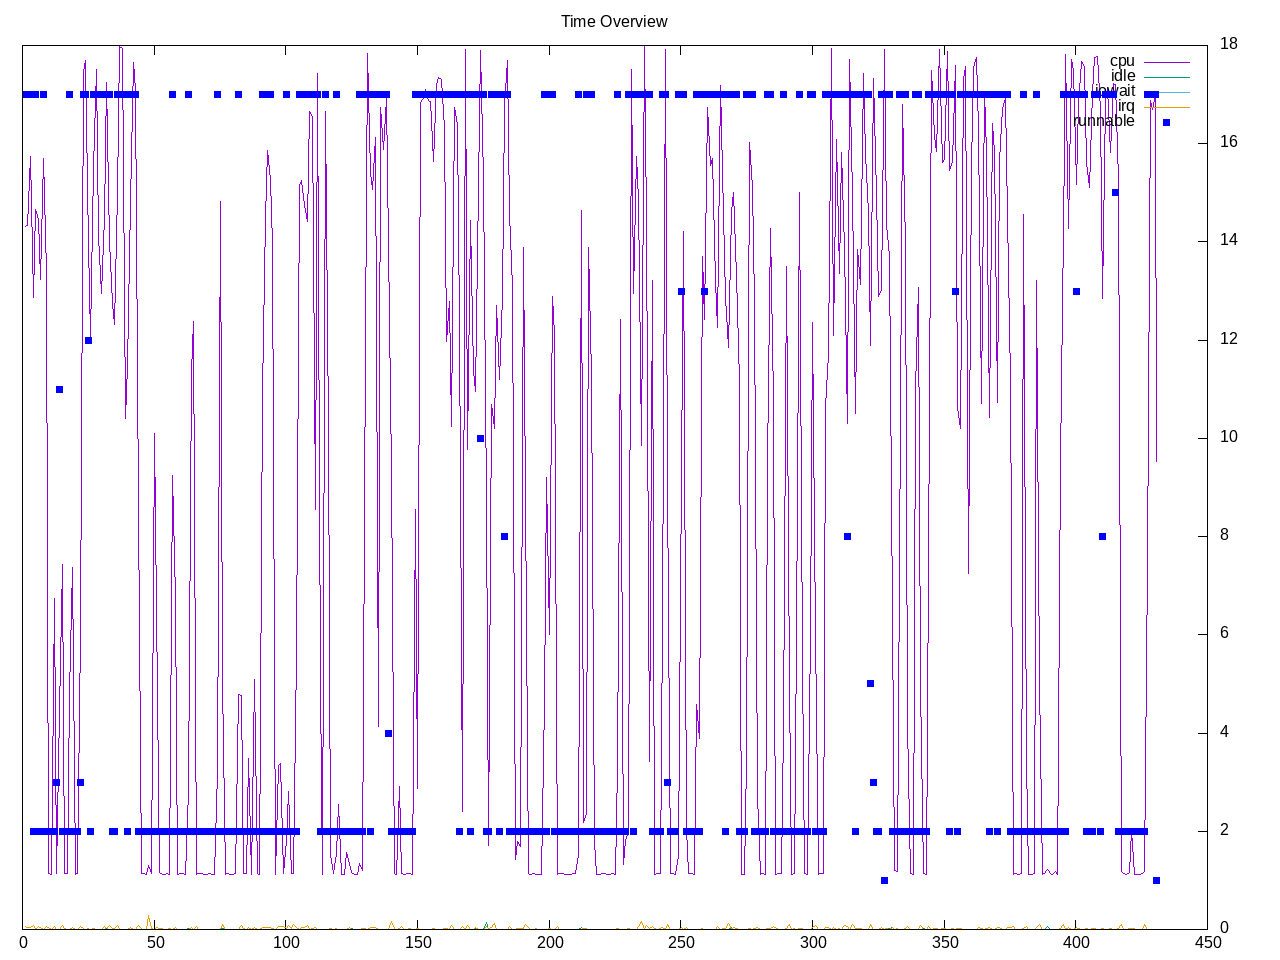
A system overview shows a mixture of benchmarks running in one core vs those running on all available cores.
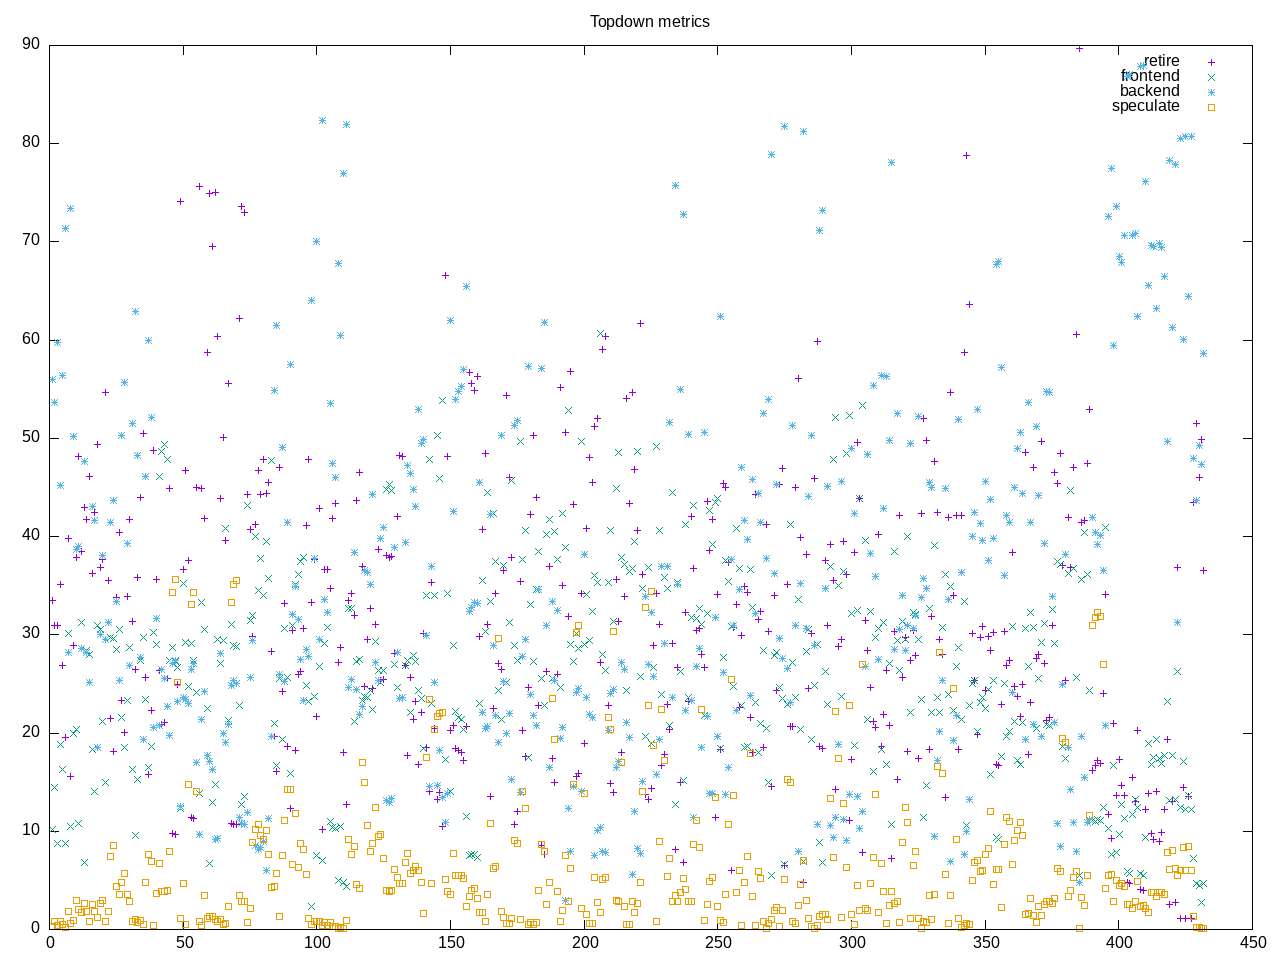
The topdown profile of the benchmarks is somewhat blurred and benchmark dependent.
Test outputs also don’t always show a very long running test, e.g. here it the output for nbody
cd benchmarks/nBody/parallelCK ; make -s
cd benchmarks/nBody/parallelCK ; numactl -i all ./testInputs_small -r 3 -p 16
3DonSphere_100000 :  -r 3 -o /tmp/ofile4755_557782 : '0.175', '0.168', '0.172', geomean = 0.172
3DinCube_100000 :  -r 3 -o /tmp/ofile752134_819802 : '0.334', '0.332', '0.336', geomean = 0.334
3Dplummer_100000 :  -r 3 -o /tmp/ofile998621_657874 : '0.724', '0.732', '0.701', geomean = 0.719
parallelCK : 16 : geomean of mins = 0.339, geomean of geomeans = 0.345
Small Inputs
The large model runs slightly faster but still in seconds, e.g. 2 seconds, 4 seconds, 6 seconds or about 30 seconds overall
HOSTNAME: augusta
Running only:  [['nBody/parallelCK', True, 0]]
running on 16 threads

cd benchmarks/nBody/parallelCK ; make -s
cd benchmarks/nBody/parallelCK ; numactl -i all ./testInputs -r 3 -p 16
3DonSphere_1000000 :  -r 3 -o /tmp/ofile687062_310171 : '1.858', '1.714', '1.703', geomean = 1.757
3DinCube_1000000 :  -r 3 -o /tmp/ofile245353_156304 : '4.125', '4.147', '4.162', geomean = 4.145
3Dplummer_1000000 :  -r 3 -o /tmp/ofile878794_743375 : '6.202', '6.166', '6.17', geomean = 6.18
parallelCK : 16 : geomean of mins = 3.512, geomean of geomeans = 3.557
It is possible to extend that slightly providing a “-r” option for more runs but overall still a fairly quickly running code.
The AMD metrics show a composite that includes a relatively average overall mix of floating point, branches, opcache, etc.
elapsed              434.115
on_cpu               0.480          # 7.68 / 16 cores
utime                3058.909
stime                274.399
nvcsw                2261861        # 98.08%
nivcsw               44272          # 1.92%
inblock              16             # 0.04/sec
onblock              50915928       # 117286.83/sec
cpu-clock            3332164205502  # 3332.164 seconds
task-clock           3333021473267  # 3333.021 seconds
page faults          104897984      # 31472.340/sec
context switches     2304869        # 691.525/sec
cpu migrations       24437          # 7.332/sec
major page faults    576            # 0.173/sec
minor page faults    104897408      # 31472.167/sec
alignment faults     0              # 0.000/sec
emulation faults     0              # 0.000/sec
branches             3147241511460  # 177.373 branches per 1000 inst
branch misses        73529245988    # 2.34% branch miss
conditional          2590299010108  # 145.985 conditional branches per 1000 inst
indirect             32139961657    # 1.811 indirect branches per 1000 inst
cpu-cycles           13860752529316 # 2.00 GHz
instructions         17687485942547 # 1.28 IPC
slots                27802291281930 #
retiring             5843337876958  # 21.0% (27.6%)
-- ucode             8123407764     #     0.0%
-- fastpath          5835214469194  #    21.0%
frontend             5116890434599  # 18.4% (24.2%)
-- latency           3089230464624  #    11.1%
-- bandwidth         2027659969975  #     7.3%
backend              9176199683559  # 33.0% (43.4%)
-- cpu               1960965413017  #     7.1%
-- memory            7215234270542  #    26.0%
speculation          1007172315506  #  3.6% ( 4.8%)
-- branch mispredict 998151183069   #     3.6%
-- pipeline restart  9021132437     #     0.0%
smt-contention       6658563270305  # 23.9% ( 0.0%)
cpu-cycles           13868909164745 # 2.00 GHz
instructions         17703619245800 # 1.28 IPC
instructions         5905011790886  # 14.896 l2 access per 1000 inst
l2 hit from l1       61946567593    # 37.33% l2 miss
l2 miss from l1      14558905287    #
l2 hit from l2 pf    7740802349     #
l3 hit from l2 pf    5494122426     #
l3 miss from l2 pf   12779715907    #
instructions         5898789410239  # 49.118 float per 1000 inst
float 512            410            # 0.000 AVX-512 per 1000 inst
float 256            476            # 0.000 AVX-256 per 1000 inst
float 128            289735641329   # 49.118 AVX-128 per 1000 inst
float MMX            0              # 0.000 MMX per 1000 inst
float scalar         55             # 0.000 scalar per 1000 inst
instructions         17711244839796 #
opcache              3147913227436  # 177.735 opcache per 1000 inst
opcache miss         115380444621   #  3.7% opcache miss rate
l1 dTLB miss         59779381014    # 3.375 L1 dTLB per 1000 inst
l2 dTLB miss         14251524341    # 0.805 L2 dTLB per 1000 inst
instructions         17707297103321 #
icache               252770587972   # 14.275 icache per 1000 inst
icache miss          10786644623    #  4.3% icache miss rate
l1 iTLB miss         58838420       # 0.003 L1 iTLB per 1000 inst
l2 iTLB miss         0              # 0.000 L2 iTLB per 1000 inst
tlb flush            208869         # 0.000 TLB flush per 1000 inst
Overall I had explored these as a potential alternative to SPEC CPU as compiler type benchmarks but seem to run a bit too quickly to be interesting. Still useful if one looks for a particular implementation of classic problems.