
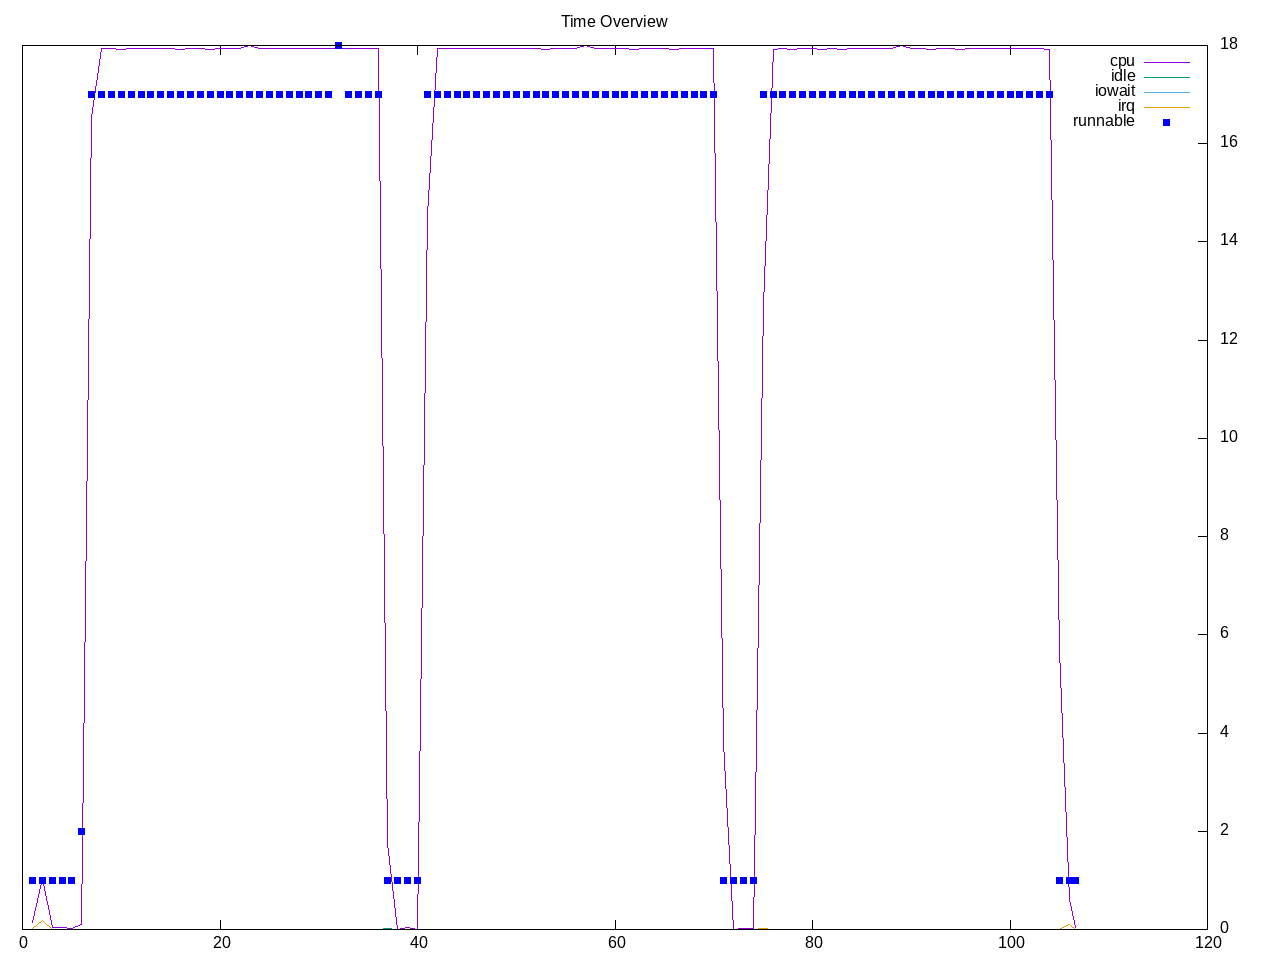
A tool for assessing WiFi/WLAN network security. Overall profile runs on all cores and overall not long running.
Topdown profile shows a high retirement rate and some backend stalls. The frontend stalls are very low as are speculation misses.

AMD metrics show very little floating point, and very little L2 access. Branches are also extremely low and also branch misprediction. Backend stalls are CPU and not memory.
elapsed              106.221
on_cpu               0.849          # 13.58 / 16 cores
utime                1438.359
stime                4.281
nvcsw                419767         # 49.29%
nivcsw               431839         # 50.71%
inblock              0              # 0.00/sec
onblock              12768          # 120.20/sec
cpu-clock            1442674894509  # 1442.675 seconds
task-clock           1442683865829  # 1442.684 seconds
page faults          179826         # 124.647/sec
context switches     851918         # 590.509/sec
cpu migrations       356            # 0.247/sec
major page faults    2              # 0.001/sec
minor page faults    179822         # 124.644/sec
alignment faults     0              # 0.000/sec
emulation faults     0              # 0.000/sec
branches             100670205778   # 8.679 branches per 1000 inst
branch misses        386381901      # 0.38% branch miss
conditional          65648933549    # 5.659 conditional branches per 1000 inst
indirect             2539166709     # 0.219 indirect branches per 1000 inst
cpu-cycles           5661422600351  # 3.33 GHz
instructions         11574238266437 # 2.04 IPC
slots                11321536244112 #
retiring             3897694469452  # 34.4% (63.0%) high
-- ucode             342319396      #     0.0%
-- fastpath          3897352150056  #    34.4%
frontend             75979705092    #  0.7% ( 1.2%) low
-- latency           49559680782    #     0.4%
-- bandwidth         26420024310    #     0.2%
backend              2208436978580  # 19.5% (35.7%)
-- cpu               1992986954518  #    17.6%
-- memory            215450024062   #     1.9%
speculation          2889765213     #  0.0% ( 0.0%) low
-- branch mispredict 2706752105     #     0.0%
-- pipeline restart  183013108      #     0.0%
smt-contention       5136520722620  # 45.4% ( 0.0%)
cpu-cycles           5656143520750  # 3.27 GHz
instructions         11560517762361 # 2.04 IPC
instructions         3854594606822  # 0.300 l2 access per 1000 inst
l2 hit from l1       1103799129     # 6.59% l2 miss
l2 miss from l1      62982112       #
l2 hit from l2 pf    38688005       #
l3 hit from l2 pf    6876032        #
l3 miss from l2 pf   6353595        #
instructions         3849645119382  # 2.221 float per 1000 inst
float 512            59             # 0.000 AVX-512 per 1000 inst
float 256            672            # 0.000 AVX-256 per 1000 inst
float 128            8549859082     # 2.221 AVX-128 per 1000 inst
float MMX            0              # 0.000 MMX per 1000 inst
float scalar         0              # 0.000 scalar per 1000 inst
instructions         2672501        #
opcache              999922         # 374.152 opcache per 1000 inst
opcache miss         536175         # 53.6% opcache miss rate
l1 dTLB miss         5747           # 2.150 L1 dTLB per 1000 inst
l2 dTLB miss         1164           # 0.436 L2 dTLB per 1000 inst
instructions         2713299        #
icache               1315776        # 484.936 icache per 1000 inst
icache miss          109361         #  8.3% icache miss rate
l1 iTLB miss         11             # 0.004 L1 iTLB per 1000 inst
l2 iTLB miss         0              # 0.000 L2 iTLB per 1000 inst
tlb flush            19             # 0.007 TLB flush per 1000 inst
Intel metrics have slight differences, more of the backend stalls are tagged as memory. The L2 access is still low. This report now has L1/L2/L3/dram metrics and almost all is with L1 and not further in the memory hierarchy.
elapsed              105.465
on_cpu               0.855          # 13.68 / 16 cores
utime                1441.663
stime                1.369
nvcsw                239565         # 50.45%
nivcsw               235338         # 49.55%
inblock              3440           # 32.62/sec
onblock              1528           # 14.49/sec
cpu-clock            1443138290326  # 1443.138 seconds
task-clock           1443145572727  # 1443.146 seconds
page faults          169266         # 117.290/sec
context switches     475213         # 329.290/sec
cpu migrations       450            # 0.312/sec
major page faults    50             # 0.035/sec
minor page faults    169214         # 117.254/sec
alignment faults     0              # 0.000/sec
emulation faults     0              # 0.000/sec
branches             55148794625    # 8.756 branches per 1000 inst
branch misses        65319097       # 0.12% branch miss
conditional          55148809537    # 8.756 conditional branches per 1000 inst
indirect             14769959782    # 2.345 indirect branches per 1000 inst
slots                7326018436796  #
retiring             3279104639029  # 44.8% (44.8%)
-- ucode             59220772205    #     0.8%
-- fastpath          3219883866824  #    44.0%
frontend             1900527422973  # 25.9% (25.9%)
-- latency           1858995130353  #    25.4%
-- bandwidth         41532292620    #     0.6%
backend              2133027687843  # 29.1% (29.1%)
-- cpu               1050005934149  #    14.3%
-- memory            1083021753694  #    14.8%
speculation          3931277836     #  0.1% ( 0.1%) low
-- branch mispredict 2579533304     #     0.0%
-- pipeline restart  1351744532     #     0.0%
smt-contention       0              #  0.0% ( 0.0%)
cpu-cycles           2467183520151  # 1.46 GHz
instructions         3282486858868  # 1.33 IPC
l2 access            953649962      # 0.294 l2 access per 1000 inst
l2 miss              126532226      # 13.27% l2 miss
cpu-cycles           3238078056998  # 24.5% memory latency
load stalls          794625463536   # 24.4% l1 bound
l1 miss              5181123582     #  0.1% l2 bound
l2 miss              3243273034     #  0.1% l3 bound
l3 miss              263341563      #  0.0% dram bound
store_stalls         209677084      #  0.0% store bound
Process overview says mostly aircrack-ng proceses.
447 processes
	 81 aircrack-ng          24449.23    39.78
	 68 clinfo                  16.53     6.21
	 38 vulkaninfo               1.14     1.14
	  4 vulkani:disk$0           0.12     0.12
	  6 glxinfo:gdrv0            0.10     0.07
	  6 glxinfo:gl0              0.10     0.07
	  6 php                      0.06     0.07
	  2 llvmpipe-0               0.06     0.06
	  2 llvmpipe-1               0.06     0.06
	  2 llvmpipe-10              0.06     0.06
	  2 llvmpipe-11              0.06     0.06
	  2 llvmpipe-12              0.06     0.06
	  2 llvmpipe-13              0.06     0.06
	  2 llvmpipe-14              0.06     0.06
	  2 llvmpipe-15              0.06     0.06
	  2 llvmpipe-2               0.06     0.06
	  2 llvmpipe-3               0.06     0.06
	  2 llvmpipe-4               0.06     0.06
	  2 llvmpipe-5               0.06     0.06
	  2 llvmpipe-6               0.06     0.06
	  2 llvmpipe-7               0.06     0.06
	  2 llvmpipe-8               0.06     0.06
	  2 llvmpipe-9               0.06     0.06
	  2 glxinfo                  0.05     0.04
	  2 glxinfo:cs0              0.05     0.04
	  2 glxinfo:disk$0           0.05     0.04
	  2 glxinfo:sh0              0.05     0.03
	  2 glxinfo:shlo0            0.05     0.03
	  6 clang                    0.04     0.08
	  3 rocminfo                 0.03     0.00
	  1 lspci                    0.00     0.02
	 82 sh                       0.00     0.00
	 13 gcc                      0.00     0.00
	 11 gsettings                0.00     0.00
	 10 sed                      0.00     0.00
	  8 stat                     0.00     0.00
	  8 systemd-detect-          0.00     0.00
	  6 llvm-link                0.00     0.00
	  5 phoronix-test-s          0.00     0.00
	  4 gmain                    0.00     0.00
	  3 awk                      0.00     0.00
	  3 ls                       0.00     0.00
	  3 tr                       0.00     0.00
	  2 cc                       0.00     0.00
	  2 lscpu                    0.00     0.00
	  2 uname                    0.00     0.00
	  2 which                    0.00     0.00
	  2 xset                     0.00     0.00
	  1 date                     0.00     0.00
	  1 dconf worker             0.00     0.00
	  1 dirname                  0.00     0.00
	  1 dmesg                    0.00     0.00
	  1 dmidecode                0.00     0.00
	  1 grep                     0.00     0.00
	  1 ifconfig                 0.00     0.00
	  1 ip                       0.00     0.00
	  1 lsmod                    0.00     0.00
	  1 mktemp                   0.00     0.00
	  1 ps                       0.00     0.00
	  1 qdbus                    0.00     0.00
	  1 readlink                 0.00     0.00
	  1 realpath                 0.00     0.00
	  1 sort                     0.00     0.00
	  1 stty                     0.00     0.00
	  1 systemctl                0.00     0.00
	  1 template.sh              0.00     0.00
	  1 wc                       0.00     0.00
	  1 xrandr                   0.00     0.00
0 processes running
47 maximum processes
Computation blocks look as follows
      336713) aircrack-ng      cpu=9 start=5.60  finish=35.64
        336714) aircrack-ng      cpu=0 start=5.60  finish=35.64
          336717) aircrack-ng      cpu=7 start=5.60  finish=5.61
            336718) aircrack-ng      cpu=14 start=5.61  finish=5.61
          336719) aircrack-ng      cpu=0 start=5.61  finish=5.61
          336720) aircrack-ng      cpu=9 start=5.61  finish=5.61
            336721) aircrack-ng      cpu=3 start=5.61  finish=5.61
            336722) sed              cpu=13 start=5.61  finish=5.61
          336723) aircrack-ng      cpu=0 start=5.61  finish=5.61
            336724) ls               cpu=7 start=5.61  finish=5.61
            336725) sed              cpu=14 start=5.61  finish=5.61
          336726) aircrack-ng      cpu=13 start=5.61  finish=5.62
          336727) aircrack-ng      cpu=9 start=5.62  finish=5.62
            336728) aircrack-ng      cpu=2 start=5.62  finish=5.62
            336729) sed              cpu=4 start=5.62  finish=5.62
          336730) aircrack-ng      cpu=0 start=5.63  finish=35.64
          336731) aircrack-ng      cpu=8 start=5.63  finish=35.64
          336732) aircrack-ng      cpu=1 start=5.63  finish=35.64
          336733) aircrack-ng      cpu=9 start=5.63  finish=35.64
          336734) aircrack-ng      cpu=2 start=5.63  finish=35.64
          336735) aircrack-ng      cpu=10 start=5.63  finish=35.64
          336736) aircrack-ng      cpu=3 start=5.63  finish=35.64
          336737) aircrack-ng      cpu=11 start=5.63  finish=35.64
          336738) aircrack-ng      cpu=4 start=5.63  finish=35.64
          336739) aircrack-ng      cpu=12 start=5.63  finish=35.64
          336740) aircrack-ng      cpu=5 start=5.63  finish=35.64
          336741) aircrack-ng      cpu=13 start=5.63  finish=35.64
          336742) aircrack-ng      cpu=6 start=5.63  finish=35.64
          336743) aircrack-ng      cpu=14 start=5.63  finish=35.64
          336744) aircrack-ng      cpu=7 start=5.63  finish=35.64
          336745) aircrack-ng      cpu=15 start=5.63  finish=35.64
        336715) tr               cpu=0 start=5.60  finish=35.64
        336716) awk              cpu=4 start=5.60  finish=35.64