
A parallel multigrid solver for linear systems. This is a quick running benchmark with one workload. It runs in parallel.
Topdown profile shows backend stalls are high and retirement is low.

AMD metrics show a moderate floating point and some L2 misses.
elapsed              65.367
on_cpu               0.683          # 10.93 / 16 cores
utime                684.184
stime                30.516
nvcsw                34261          # 78.49%
nivcsw               9387           # 21.51%
inblock              0              # 0.00/sec
onblock              62128          # 950.45/sec
cpu-clock            715137381360   # 715.137 seconds
task-clock           715190259831   # 715.190 seconds
page faults          8807369        # 12314.722/sec
context switches     43781          # 61.216/sec
cpu migrations       849            # 1.187/sec
major page faults    239            # 0.334/sec
minor page faults    8807130        # 12314.388/sec
alignment faults     0              # 0.000/sec
emulation faults     0              # 0.000/sec
branches             169782624025   # 175.891 branches per 1000 inst
branch misses        4319878460     # 2.54% branch miss
conditional          156304404289   # 161.928 conditional branches per 1000 inst
indirect             666734996      # 0.691 indirect branches per 1000 inst
cpu-cycles           3172142083659  # 3.01 GHz
instructions         963009042257   # 0.30 IPC low
slots                6345218376984  #
retiring             296090878240   #  4.7% ( 5.7%) low
-- ucode             539766775      #     0.0%
-- fastpath          295551111465   #     4.7%
frontend             884404390044   # 13.9% (17.1%)
-- latency           689529138882   #    10.9%
-- bandwidth         194875251162   #     3.1%
backend              3967267557245  # 62.5% (76.5%) high
-- cpu               339701703779   #     5.4%
-- memory            3627565853466  #    57.2%
speculation          37459376987    #  0.6% ( 0.7%) low
-- branch mispredict 37031973884    #     0.6%
-- pipeline restart  427403103      #     0.0%
smt-contention       1159992696623  # 18.3% ( 0.0%)
cpu-cycles           3171306945071  # 3.02 GHz
instructions         970302048523   # 0.31 IPC low
instructions         323788798692   # 61.769 l2 access per 1000 inst
l2 hit from l1       12459651257    # 38.69% l2 miss
l2 miss from l1      1594283255     #
l2 hit from l2 pf    1396247525     #
l3 hit from l2 pf    82285311       #
l3 miss from l2 pf   6061785869     #
instructions         322826762239   # 117.391 float per 1000 inst
float 512            66             # 0.000 AVX-512 per 1000 inst
float 256            648            # 0.000 AVX-256 per 1000 inst
float 128            37896810350    # 117.391 AVX-128 per 1000 inst
float MMX            0              # 0.000 MMX per 1000 inst
float scalar         0              # 0.000 scalar per 1000 inst
instructions         2686030        #
opcache              1004915        # 374.126 opcache per 1000 inst
opcache miss         540008         # 53.7% opcache miss rate
l1 dTLB miss         6463           # 2.406 L1 dTLB per 1000 inst
l2 dTLB miss         1151           # 0.429 L2 dTLB per 1000 inst
instructions         2696784        #
icache               1305399        # 484.058 icache per 1000 inst
icache miss          107358         #  8.2% icache miss rate
l1 iTLB miss         8              # 0.003 L1 iTLB per 1000 inst
l2 iTLB miss         0              # 0.000 L2 iTLB per 1000 inst
tlb flush            19             # 0.007 TLB flush per 1000 inst
Intel metrics show backend CPU stalls and also dram memory stalls.
elapsed              130.375
on_cpu               0.815          # 13.04 / 16 cores
utime                1661.904
stime                37.999
nvcsw                78342          # 60.06%
nivcsw               52092          # 39.94%
inblock              30352          # 232.81/sec
onblock              50968          # 390.93/sec
cpu-clock            1700050318910  # 1700.050 seconds
task-clock           1700071060304  # 1700.071 seconds
page faults          13107552       # 7710.002/sec
context switches     130884         # 76.987/sec
cpu migrations       19282          # 11.342/sec
major page faults    879            # 0.517/sec
minor page faults    13106673       # 7709.485/sec
alignment faults     0              # 0.000/sec
emulation faults     0              # 0.000/sec
branches             1266941103776  # 184.143 branches per 1000 inst
branch misses        7059189438     # 0.56% branch miss
conditional          1266941120608  # 184.143 conditional branches per 1000 inst
indirect             449036973724   # 65.265 indirect branches per 1000 inst
slots                8910379799354  #
retiring             3624326751784  # 40.7% (40.7%)
-- ucode             373643885674   #     4.2%
-- fastpath          3250682866110  #    36.5%
frontend             1015307188635  # 11.4% (11.4%)
-- latency           629549610931   #     7.1%
-- bandwidth         385757577704   #     4.3%
backend              4111358559413  # 46.1% (46.1%)
-- cpu               2398629919885  #    26.9%
-- memory            1712728639528  #    19.2%
speculation          446666376364   #  5.0% ( 5.0%)
-- branch mispredict 399480325933   #     4.5%
-- pipeline restart  47186050431    #     0.5%
smt-contention       0              #  0.0% ( 0.0%)
cpu-cycles           5541763745828  # 2.68 GHz
instructions         7359688889580  # 1.33 IPC
l2 access            41605258580    # 11.616 l2 access per 1000 inst
l2 miss              23999846272    # 57.68% l2 miss
cpu-cycles           2695525220705  # 27.5% memory latency
load stalls          728696875722   #  1.4% l1 bound
l1 miss              691796917416   #  4.9% l2 bound
l2 miss              560621251095   #  5.2% l3 bound
l3 miss              419917879058   # 15.6% dram bound
store_stalls         12075917152    #  0.4% store bound
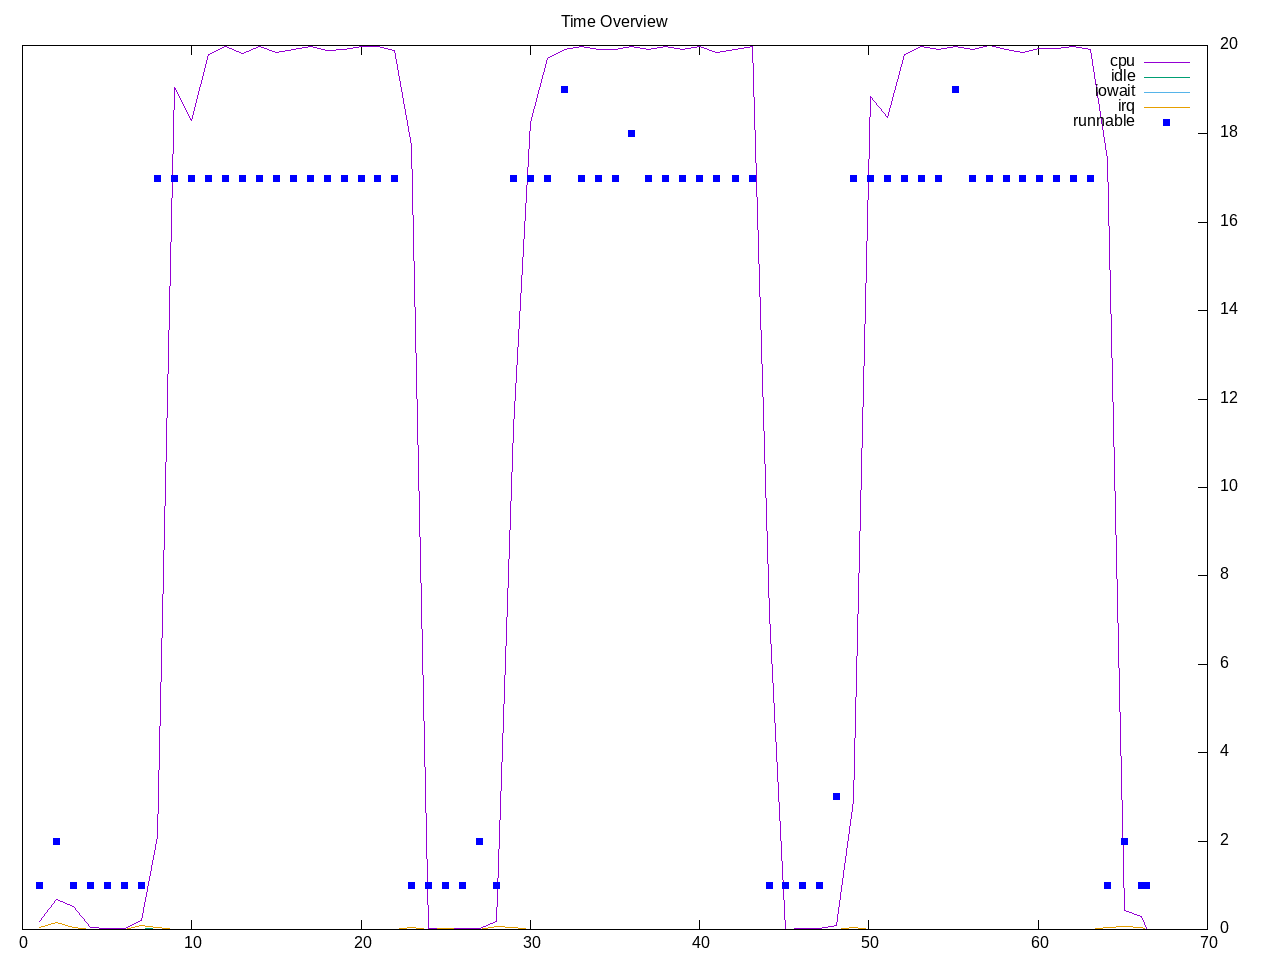
Process overview shows the amg process accumulating the overall time.
465 processes
	 99 amg                   2730.94   114.56
	 68 clinfo                  16.86     5.98
	 38 vulkaninfo               0.75     1.34
	 18 mpirun                   0.71     2.20
	  4 vulkani:disk$0           0.08     0.14
	  6 clang                    0.08     0.04
	  6 php                      0.07     0.06
	  6 glxinfo:gdrv0            0.05     0.08
	  6 glxinfo:gl0              0.05     0.08
	  2 llvmpipe-0               0.04     0.07
	  2 llvmpipe-1               0.04     0.07
	  2 llvmpipe-10              0.04     0.07
	  2 llvmpipe-11              0.04     0.07
	  2 llvmpipe-12              0.04     0.07
	  2 llvmpipe-13              0.04     0.07
	  2 llvmpipe-14              0.04     0.07
	  2 llvmpipe-15              0.04     0.07
	  2 llvmpipe-2               0.04     0.07
	  2 llvmpipe-3               0.04     0.07
	  2 llvmpipe-4               0.04     0.07
	  2 llvmpipe-5               0.04     0.07
	  2 llvmpipe-6               0.04     0.07
	  2 llvmpipe-7               0.04     0.07
	  2 llvmpipe-8               0.04     0.07
	  2 llvmpipe-9               0.04     0.07
	  2 glxinfo                  0.03     0.04
	  2 glxinfo:cs0              0.03     0.04
	  2 glxinfo:disk$0           0.03     0.04
	  2 glxinfo:sh0              0.03     0.04
	  2 glxinfo:shlo0            0.03     0.04
	  3 rocminfo                 0.00     0.03
	  1 lspci                    0.00     0.01
	 82 sh                       0.00     0.00
	 13 gcc                      0.00     0.00
	 10 gsettings                0.00     0.00
	  8 stat                     0.00     0.00
	  8 systemd-detect-          0.00     0.00
	  6 llvm-link                0.00     0.00
	  5 phoronix-test-s          0.00     0.00
	  3 dconf worker             0.00     0.00
	  3 gmain                    0.00     0.00
	  2 cc                       0.00     0.00
	  2 lscpu                    0.00     0.00
	  2 uname                    0.00     0.00
	  2 which                    0.00     0.00
	  2 xset                     0.00     0.00
	  1 date                     0.00     0.00
	  1 dirname                  0.00     0.00
	  1 dmesg                    0.00     0.00
	  1 dmidecode                0.00     0.00
	  1 grep                     0.00     0.00
	  1 ifconfig                 0.00     0.00
	  1 ip                       0.00     0.00
	  1 lsmod                    0.00     0.00
	  1 mktemp                   0.00     0.00
	  1 ps                       0.00     0.00
	  1 qdbus                    0.00     0.00
	  1 readlink                 0.00     0.00
	  1 realpath                 0.00     0.00
	  1 sed                      0.00     0.00
	  1 sort                     0.00     0.00
	  1 stty                     0.00     0.00
	  1 systemctl                0.00     0.00
	  1 template.sh              0.00     0.00
	  1 wc                       0.00     0.00
	  1 xrandr                   0.00     0.00
0 processes running
47 maximum processes
Computation structure shows this as a MPI program
      354246) amg              cpu=5 start=5.51  finish=22.04
        354247) mpirun           cpu=1 start=5.51  finish=22.02
          354250) mpirun           cpu=15 start=6.09  finish=22.02
          354251) mpirun           cpu=8 start=6.09  finish=6.09
          354252) mpirun           cpu=9 start=6.11  finish=22.02
          354253) mpirun           cpu=2 start=6.59  finish=22.02
          354254) mpirun           cpu=2 start=6.60  finish=22.02
          354255) amg              cpu=3 start=6.63  finish=22.00
            354257) amg              cpu=7 start=6.64  finish=21.99
            354260) amg              cpu=10 start=6.64  finish=21.99
            354285) amg              cpu=10 start=6.88  finish=22.00
          354256) amg              cpu=7 start=6.63  finish=22.00
            354259) amg              cpu=14 start=6.64  finish=21.99
            354262) amg              cpu=4 start=6.65  finish=21.99
            354283) amg              cpu=11 start=6.88  finish=22.00
          354258) amg              cpu=6 start=6.64  finish=22.00
            354263) amg              cpu=14 start=6.65  finish=21.99
            354266) amg              cpu=9 start=6.65  finish=21.99
            354279) amg              cpu=14 start=6.88  finish=22.00
          354261) amg              cpu=13 start=6.64  finish=21.99
            354265) amg              cpu=10 start=6.65  finish=21.99
            354269) amg              cpu=5 start=6.66  finish=21.99
            354282) amg              cpu=4 start=6.88  finish=21.99
          354264) amg              cpu=12 start=6.65  finish=21.99
            354268) amg              cpu=9 start=6.66  finish=21.99
            354272) amg              cpu=11 start=6.66  finish=21.99
            354286) amg              cpu=11 start=6.88  finish=21.99
          354267) amg              cpu=1 start=6.65  finish=21.99
            354271) amg              cpu=5 start=6.66  finish=21.99
            354275) amg              cpu=14 start=6.67  finish=21.99
            354284) amg              cpu=9 start=6.88  finish=21.99
          354270) amg              cpu=2 start=6.66  finish=21.99
            354274) amg              cpu=12 start=6.66  finish=21.99
            354277) amg              cpu=13 start=6.67  finish=21.99
            354281) amg              cpu=5 start=6.88  finish=22.00
          354273) amg              cpu=0 start=6.66  finish=21.99
            354276) amg              cpu=10 start=6.67  finish=21.99
            354278) amg              cpu=15 start=6.67  finish=21.99
            354280) amg              cpu=10 start=6.88  finish=21.99