
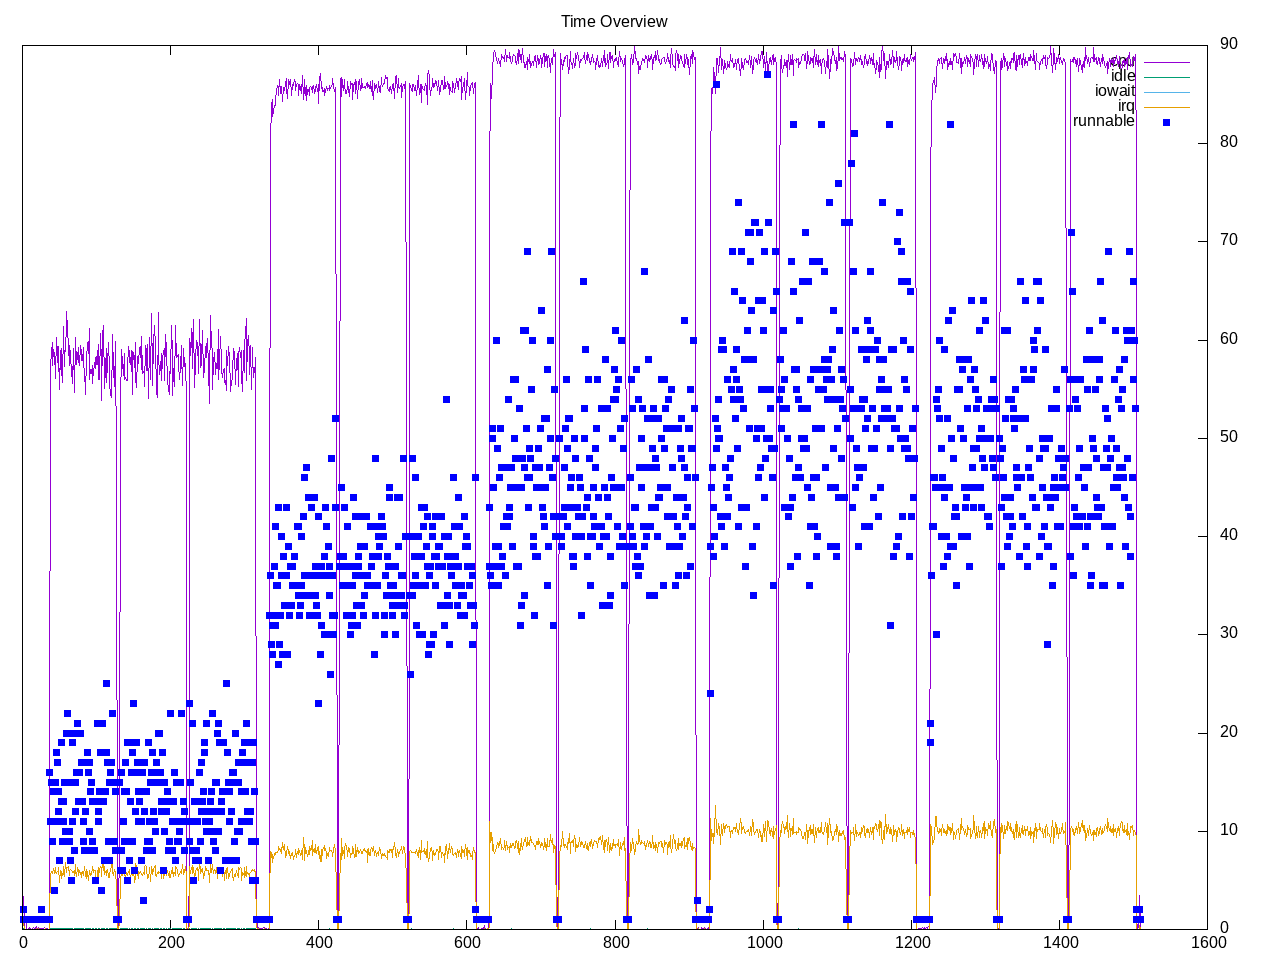
Apache benchmark has six different workloads with increasing numbers of concurrent requests also shown with more concurrent processes. The overall time spent in interrupts is higher than other workloads, otherwise CPU cores are kept busy.
Topdown metrics show a lot of time in frontend stalls. A constant and low retirement rate.

AMD topdown metrics with on cpu about 4 cores worth and a lot of context switches. Not much floating point.
elapsed              1509.346
on_cpu               0.220          # 3.52 / 16 cores
utime                573.840
stime                4744.594
nvcsw                44951008       # 45.34%
nivcsw               54184990       # 54.66%
inblock              0              # 0.00/sec
onblock              29792          # 19.74/sec
cpu-clock            19676541323775 # 19676.541 seconds
task-clock           19719318674895 # 19719.319 seconds
page faults          284461013      # 14425.499/sec
context switches     454358925      # 23041.310/sec
cpu migrations       115592313      # 5861.882/sec
major page faults    942757         # 47.809/sec
minor page faults    283518256      # 14377.690/sec
alignment faults     0              # 0.000/sec
emulation faults     0              # 0.000/sec
branches             6758295849529  # 211.749 branches per 1000 inst
branch misses        799095641827   # 11.82% branch miss
conditional          3637789008753  # 113.978 conditional branches per 1000 inst
indirect             147995495873   # 4.637 indirect branches per 1000 inst
cpu-cycles           77915946609317 # 3.23 GHz
instructions         32290962771129 # 0.41 IPC
slots                154254506163852 #
retiring             12893918613334 #  8.4% ( 9.0%)
-- ucode             83973017436    #     0.1%
-- fastpath          12809945595898 #     8.3%
frontend             100257449117427 # 65.0% (70.3%)
-- latency           82212142241388 #    53.3%
-- bandwidth         18045306876039 #    11.7%
backend              28359866429194 # 18.4% (19.9%)
-- cpu               4582663552209  #     3.0%
-- memory            23777202876985 #    15.4%
speculation          1132261153110  #  0.7% ( 0.8%)
-- branch mispredict 1128091469818  #     0.7%
-- pipeline restart  4169683292     #     0.0%
smt-contention       11597513599477 #  7.5% ( 0.0%)
cpu-cycles           77816961127337 # 3.22 GHz
instructions         32506652562355 # 0.42 IPC
instructions         10709521517503 # 169.776 l2 access per 1000 inst
l2 hit from l1       1489725697344  # 30.94% l2 miss
l2 miss from l1      361201826450   #
l2 hit from l2 pf    127168999107   #
l3 hit from l2 pf    148824282710   #
l3 miss from l2 pf   52496129210    #
instructions         10712155474180 # 11.051 float per 1000 inst
float 512            99             # 0.000 AVX-512 per 1000 inst
float 256            540            # 0.000 AVX-256 per 1000 inst
float 128            118385183778   # 11.051 AVX-128 per 1000 inst
float MMX            0              # 0.000 MMX per 1000 inst
float scalar         0              # 0.000 scalar per 1000 inst
Intel metrics
elapsed              1791.168
on_cpu               0.224          # 3.59 / 16 cores
utime                678.312
stime                5748.159
nvcsw                88888704       # 59.64%
nivcsw               60148521       # 40.36%
inblock              96             # 0.05/sec
onblock              18616          # 10.39/sec
cpu-clock            23302759563125 # 23302.760 seconds
task-clock           23352428926479 # 23352.429 seconds
page faults          348216383      # 14911.356/sec
context switches     557678073      # 23880.945/sec
cpu migrations       199654149      # 8549.610/sec
major page faults    1369530        # 58.646/sec
minor page faults    346846853      # 14852.710/sec
alignment faults     0              # 0.000/sec
emulation faults     0              # 0.000/sec
branches             6831132246467  # 182.969 branches per 1000 inst
branch misses        75286038756    # 1.10% branch miss
conditional          6831132375619  # 182.969 conditional branches per 1000 inst
indirect             1731845496944  # 46.387 indirect branches per 1000 inst
slots                94143096190466 #
retiring             20164455696645 # 21.4% (21.4%)
-- ucode             3374369293277  #     3.6%
-- fastpath          16790086403368 #    17.8%
frontend             39152021412138 # 41.6% (41.6%)
-- latency           27001499422697 #    28.7%
-- bandwidth         12150521989441 #    12.9%
backend              31775642691837 # 33.8% (33.8%)
-- cpu               8124393282042  #     8.6%
-- memory            23651249409795 #    25.1%
speculation          3892549696503  #  4.1% ( 4.1%)
-- branch mispredict 3486065436745  #     3.7%
-- pipeline restart  406484259758   #     0.4%
smt-contention       0              #  0.0% ( 0.0%)
cpu-cycles           62935596128790 # 2.61 GHz
instructions         37441908212762 # 0.59 IPC
l2 access            2517537664684  # 137.746 l2 access per 1000 inst
l2 miss              848413614451   # 33.70% l2 miss
Process overview shows we have (and reuse) httpd processes and wrk processes.
3286 processes
	2594 httpd                83589.41 302478.62
	258 wrk                  10120.92 81770.17
	 68 clinfo                  20.51     5.98
	 38 vulkaninfo               1.33     1.33
	  6 glxinfo:gdrv0            0.17     0.07
	  4 vulkani:disk$0           0.14     0.14
	  6 php                      0.10     0.28
	  2 glxinfo                  0.09     0.03
	  2 glxinfo:cs0              0.08     0.03
	  2 glxinfo:disk$0           0.08     0.03
	  2 glxinfo:sh0              0.08     0.03
	  2 glxinfo:shlo0            0.08     0.03
	  2 llvmpipe-0               0.07     0.07
	  2 llvmpipe-1               0.07     0.07
	  2 llvmpipe-10              0.07     0.07
	  2 llvmpipe-11              0.07     0.07
	  2 llvmpipe-12              0.07     0.07
	  2 llvmpipe-13              0.07     0.07
	  2 llvmpipe-14              0.07     0.07
	  2 llvmpipe-15              0.07     0.07
	  2 llvmpipe-2               0.07     0.07
	  2 llvmpipe-3               0.07     0.07
	  2 llvmpipe-4               0.07     0.07
	  2 llvmpipe-5               0.07     0.07
	  2 llvmpipe-6               0.07     0.07
	  2 llvmpipe-7               0.07     0.07
	  2 llvmpipe-8               0.07     0.07
	  2 llvmpipe-9               0.07     0.07
	  6 clang                    0.05     0.07
	  3 rocminfo                 0.03     0.00
	  1 lspci                    0.01     0.02
	102 sh                       0.00     0.00
	 24 apachectl                0.00     0.00
	 18 apache                   0.00     0.00
	 13 gcc                      0.00     0.00
	 12 bash                     0.00     0.00
	 12 sleep                    0.00     0.00
	  9 gsettings                0.00     0.00
	  8 stat                     0.00     0.00
	  8 systemd-detect-          0.00     0.00
	  6 llvm-link                0.00     0.00
	  6 rm                       0.00     0.00
	  5 phoronix-test-s          0.00     0.00
	  4 gmain                    0.00     0.00
	  3 dconf worker             0.00     0.00
	  2 cc                       0.00     0.00
	  2 lscpu                    0.00     0.00
	  2 uname                    0.00     0.00
	  2 which                    0.00     0.00
	  2 xset                     0.00     0.00
	  1 date                     0.00     0.00
	  1 dirname                  0.00     0.00
	  1 dmesg                    0.00     0.00
	  1 dmidecode                0.00     0.00
	  1 grep                     0.00     0.00
	  1 ifconfig                 0.00     0.00
	  1 ip                       0.00     0.00
	  1 lsmod                    0.00     0.00
	  1 mktemp                   0.00     0.00
	  1 ps                       0.00     0.00
	  1 qdbus                    0.00     0.00
	  1 readlink                 0.00     0.00
	  1 realpath                 0.00     0.00
	  1 sed                      0.00     0.00
	  1 sort                     0.00     0.00
	  1 stty                     0.00     0.00
	  1 systemctl                0.00     0.00
	  1 template.sh              0.00     0.00
	  1 wc                       0.00     0.00
	  1 xrandr                   0.00     0.00
0 processes running
461 maximum processes