
A CPU and GPU numeric processing library, using both built-in CPU and OpenCL benchmarks. All run on my AMD system and the OpenCL fp16 fails on my Intel system. The OpenCL fp32 passes on Intel The AMD is considerably faster, so curious if I am getting some GPU? Looks like the first two workloads are multi-threaded and the rest are single-threaded.
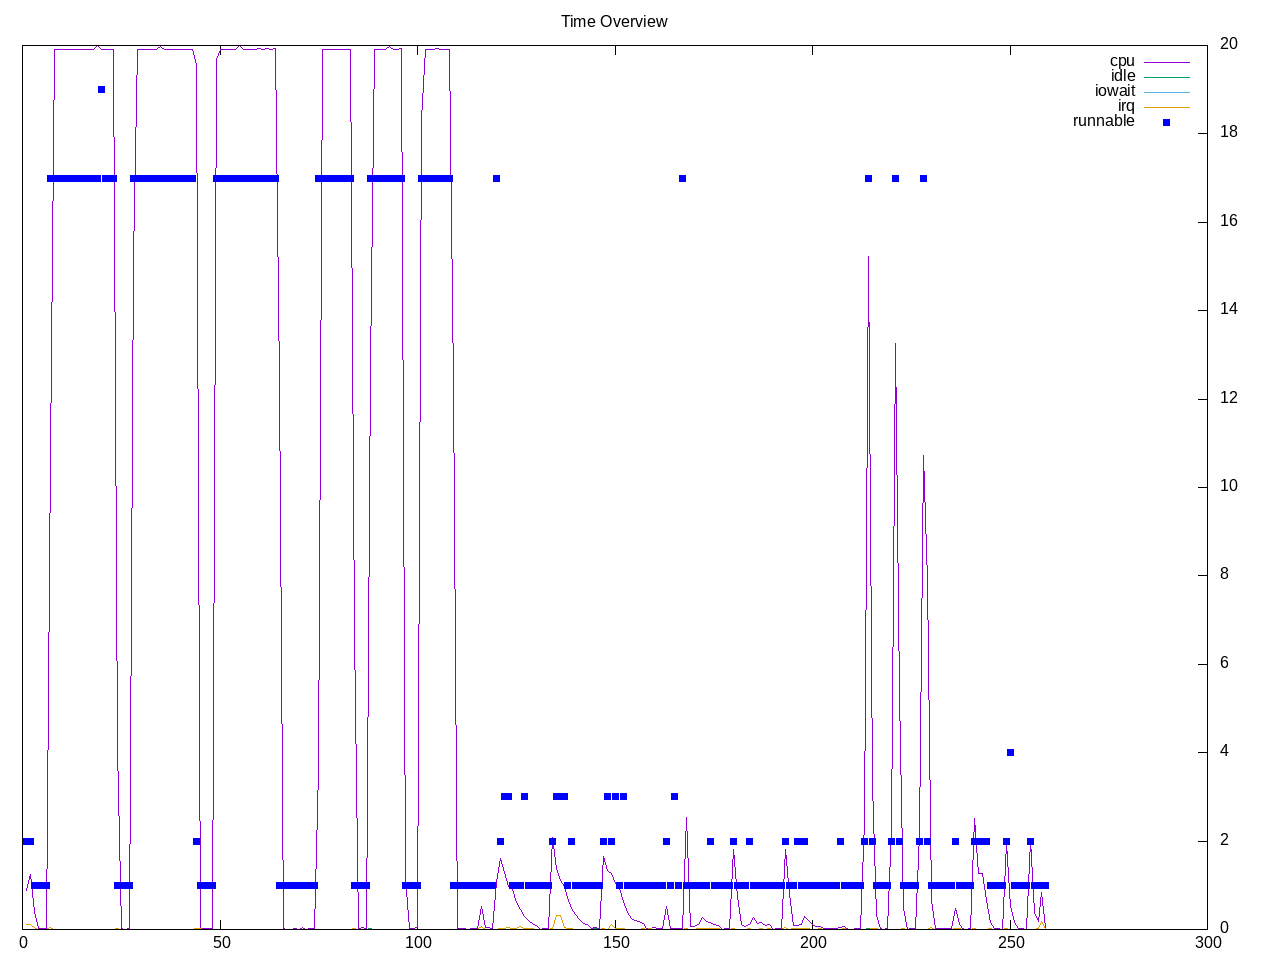
Topdown profile shows frontend stalls as high and some variation between workloads and over time.
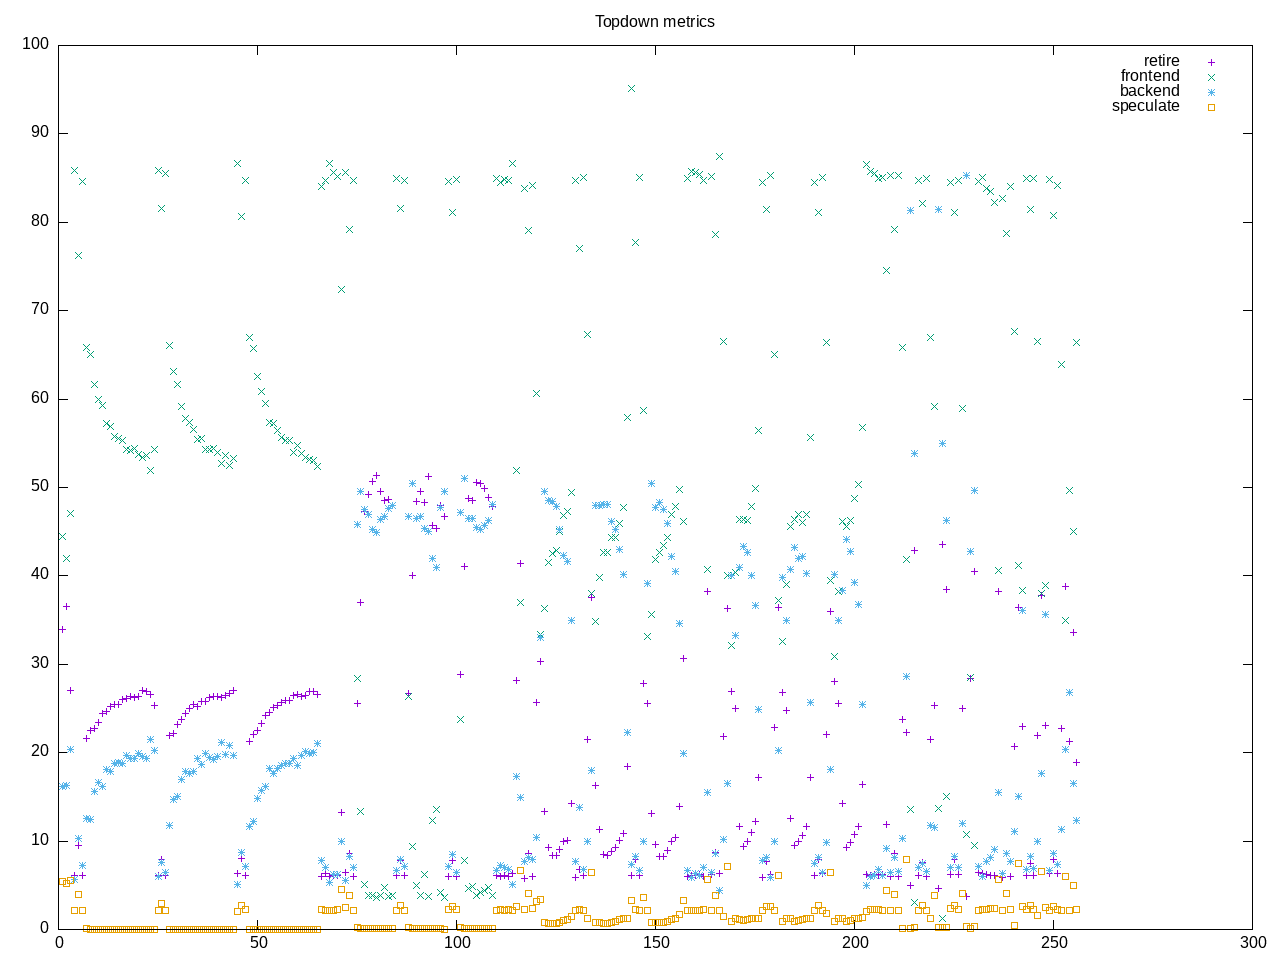
AMD metrics show little floating point and moderate numbers of branches. Some L2 access though not particularly high backend stalls.
elapsed              255.589
on_cpu               0.316          # 5.05 / 16 cores
utime                769.161
stime                522.034
nvcsw                84146          # 54.56%
nivcsw               70084          # 45.44%
inblock              0              # 0.00/sec
onblock              156304         # 611.54/sec
cpu-clock            1297086975088  # 1297.087 seconds
task-clock           1297163581400  # 1297.164 seconds
page faults          1828517        # 1409.627/sec
context switches     155290         # 119.715/sec
cpu migrations       1592           # 1.227/sec
major page faults    155            # 0.119/sec
minor page faults    1828362        # 1409.508/sec
alignment faults     0              # 0.000/sec
emulation faults     0              # 0.000/sec
branches             566661991334   # 91.881 branches per 1000 inst
branch misses        61259641104    # 10.81% branch miss
conditional          252994830141   # 41.022 conditional branches per 1000 inst
indirect             24440357358    # 3.963 indirect branches per 1000 inst
cpu-cycles           5083213642342  # 1.21 GHz
instructions         6172430147473  # 1.21 IPC
slots                10170139884144 #
retiring             2242627936735  # 22.1% (29.2%)
-- ucode             8206700190     #     0.1%
-- fastpath          2234421236545  #    22.0%
frontend             3184418817599  # 31.3% (41.5%)
-- latency           2649897791970  #    26.1%
-- bandwidth         534521025629   #     5.3%
backend              2238686350080  # 22.0% (29.2%)
-- cpu               1024364604864  #    10.1%
-- memory            1214321745216  #    11.9%
speculation          10863172263    #  0.1% ( 0.1%) low
-- branch mispredict 10849523258    #     0.1%
-- pipeline restart  13649005       #     0.0%
smt-contention       2493533444045  # 24.5% ( 0.0%)
cpu-cycles           5022114467177  # 1.22 GHz
instructions         6157130266342  # 1.23 IPC
instructions         2057106720487  # 49.333 l2 access per 1000 inst
l2 hit from l1       86581943288    # 9.06% l2 miss
l2 miss from l1      2752199852     #
l2 hit from l2 pf    8456824069     #
l3 hit from l2 pf    5607231135     #
l3 miss from l2 pf   836878029      #
instructions         2053827320707  # 21.171 float per 1000 inst
float 512            83             # 0.000 AVX-512 per 1000 inst
float 256            508            # 0.000 AVX-256 per 1000 inst
float 128            43480827313    # 21.171 AVX-128 per 1000 inst
float MMX            0              # 0.000 MMX per 1000 inst
float scalar         0              # 0.000 scalar per 1000 inst
instructions         2665431        #
opcache              988658         # 370.919 opcache per 1000 inst
opcache miss         530873         # 53.7% opcache miss rate
l1 dTLB miss         5558           # 2.085 L1 dTLB per 1000 inst
l2 dTLB miss         1178           # 0.442 L2 dTLB per 1000 inst
instructions         2715463        #
icache               1322587        # 487.058 icache per 1000 inst
icache miss          112382         #  8.5% icache miss rate
l1 iTLB miss         14             # 0.005 L1 iTLB per 1000 inst
l2 iTLB miss         0              # 0.000 L2 iTLB per 1000 inst
tlb flush            19             # 0.007 TLB flush per 1000 inst
Intel metrics show lower on-cpu and both L2 and dram stalls.
elapsed              749.501
on_cpu               0.116          # 1.85 / 16 cores
utime                1332.666
stime                55.026
nvcsw                515494         # 6.33%
nivcsw               7622108        # 93.67%
inblock              15760          # 21.03/sec
onblock              10456          # 13.95/sec
cpu-clock            1384483475706  # 1384.483 seconds
task-clock           1384896944201  # 1384.897 seconds
page faults          5647449        # 4077.884/sec
context switches     8141137        # 5878.515/sec
cpu migrations       120081         # 86.708/sec
major page faults    163            # 0.118/sec
minor page faults    5647286        # 4077.766/sec
alignment faults     0              # 0.000/sec
emulation faults     0              # 0.000/sec
branches             327470422030   # 29.701 branches per 1000 inst
branch misses        2265053860     # 0.69% branch miss
conditional          327470459310   # 29.701 conditional branches per 1000 inst
indirect             45635483920    # 4.139 indirect branches per 1000 inst
slots                21933232930778 #
retiring             12264288512056 # 55.9% (55.9%) high
-- ucode             701472801784   #     3.2%
-- fastpath          11562815710272 #    52.7%
frontend             2803267333224  # 12.8% (12.8%)
-- latency           1783243291316  #     8.1%
-- bandwidth         1020024041908  #     4.7%
backend              6871443097914  # 31.3% (31.3%)
-- cpu               3842821497310  #    17.5%
-- memory            3028621600604  #    13.8%
speculation          1485815766476  #  6.8% ( 6.8%)
-- branch mispredict 1451257286366  #     6.6%
-- pipeline restart  34558480110    #     0.2%
smt-contention       0              #  0.0% ( 0.0%)
cpu-cycles           5173265968393  # 0.39 GHz
instructions         14473440438126 # 2.80 IPC
l2 access            178180311971   # 17.066 l2 access per 1000 inst
l2 miss              83307874133    # 46.75% l2 miss
cpu-cycles           4579755625449  # 28.7% memory latency
load stalls          1298392731852  #  0.5% l1 bound
l1 miss              1273798954929  # 10.5% l2 bound
l2 miss              794601654431   #  5.6% l3 bound
l3 miss              539003203401   # 11.8% dram bound
store_stalls         17972241280    #  0.4% store bound
AMD metrics show most of the time in the blas_cpu process.
1198 processes
	102 blas_cpu             12168.09  8389.18
	 51 cg_cpu                 695.13   183.60
	306 blas_opencl            373.02   658.65
	153 cg_opencl              140.62   150.05
	272 clinfo                  74.48    24.64
	 38 vulkaninfo               1.14     1.14
	  6 glxinfo:gdrv0            0.13     0.03
	  6 glxinfo:gl0              0.13     0.03
	  4 vulkani:disk$0           0.12     0.12
	  6 php                      0.10     0.15
	  2 glxinfo                  0.08     0.02
	  2 glxinfo:cs0              0.08     0.02
	  2 glxinfo:disk$0           0.07     0.02
	  2 glxinfo:sh0              0.07     0.01
	  2 glxinfo:shlo0            0.07     0.01
	  2 llvmpipe-0               0.06     0.06
	  2 llvmpipe-1               0.06     0.06
	  2 llvmpipe-10              0.06     0.06
	  2 llvmpipe-11              0.06     0.06
	  2 llvmpipe-12              0.06     0.06
	  2 llvmpipe-13              0.06     0.06
	  2 llvmpipe-14              0.06     0.06
	  2 llvmpipe-15              0.06     0.06
	  2 llvmpipe-2               0.06     0.06
	  2 llvmpipe-3               0.06     0.06
	  2 llvmpipe-4               0.06     0.06
	  2 llvmpipe-5               0.06     0.06
	  2 llvmpipe-6               0.06     0.06
	  2 llvmpipe-7               0.06     0.06
	  2 llvmpipe-8               0.06     0.06
	  2 llvmpipe-9               0.06     0.06
	  6 clang                    0.05     0.05
	  3 rocminfo                 0.03     0.03
	  1 lspci                    0.01     0.02
	  1 ps                       0.00     0.01
	 98 sh                       0.00     0.00
	 18 arrayfire                0.00     0.00
	 13 gcc                      0.00     0.00
	 11 gsettings                0.00     0.00
	  8 stat                     0.00     0.00
	  8 systemd-detect-          0.00     0.00
	  6 llvm-link                0.00     0.00
	  5 phoronix-test-s          0.00     0.00
	  3 gmain                    0.00     0.00
	  2 cc                       0.00     0.00
	  2 dconf worker             0.00     0.00
	  2 lscpu                    0.00     0.00
	  2 uname                    0.00     0.00
	  2 which                    0.00     0.00
	  2 xset                     0.00     0.00
	  1 date                     0.00     0.00
	  1 dirname                  0.00     0.00
	  1 dmesg                    0.00     0.00
	  1 dmidecode                0.00     0.00
	  1 grep                     0.00     0.00
	  1 ifconfig                 0.00     0.00
	  1 ip                       0.00     0.00
	  1 lsmod                    0.00     0.00
	  1 mktemp                   0.00     0.00
	  1 qdbus                    0.00     0.00
	  1 readlink                 0.00     0.00
	  1 realpath                 0.00     0.00
	  1 sed                      0.00     0.00
	  1 sort                     0.00     0.00
	  1 stty                     0.00     0.00
	  1 systemctl                0.00     0.00
	  1 template.sh              0.00     0.00
	  1 wc                       0.00     0.00
	  1 xrandr                   0.00     0.00
0 processes running
59 maximum processes
Computation blocks look as follows
      363808) arrayfire        cpu=5 start=6.95  finish=23.75
        363809) blas_cpu         cpu=7 start=6.95  finish=23.73
          363810) blas_cpu         cpu=14 start=6.96  finish=23.73
          363811) blas_cpu         cpu=10 start=6.96  finish=23.73
          363812) blas_cpu         cpu=4 start=6.96  finish=23.73
          363813) blas_cpu         cpu=9 start=6.96  finish=23.73
          363814) blas_cpu         cpu=8 start=6.96  finish=23.73
          363815) blas_cpu         cpu=3 start=6.96  finish=23.73
          363816) blas_cpu         cpu=5 start=6.96  finish=23.73
          363817) blas_cpu         cpu=15 start=6.96  finish=23.73
          363818) blas_cpu         cpu=0 start=6.96  finish=23.73
          363819) blas_cpu         cpu=6 start=6.96  finish=23.73
          363820) blas_cpu         cpu=12 start=6.96  finish=23.73
          363821) blas_cpu         cpu=1 start=6.96  finish=23.73
          363822) blas_cpu         cpu=11 start=6.96  finish=23.73
          363823) blas_cpu         cpu=2 start=6.96  finish=23.72
          363824) blas_cpu         cpu=13 start=6.96  finish=23.72
          363825) blas_cpu         cpu=7 start=6.96  finish=23.73