
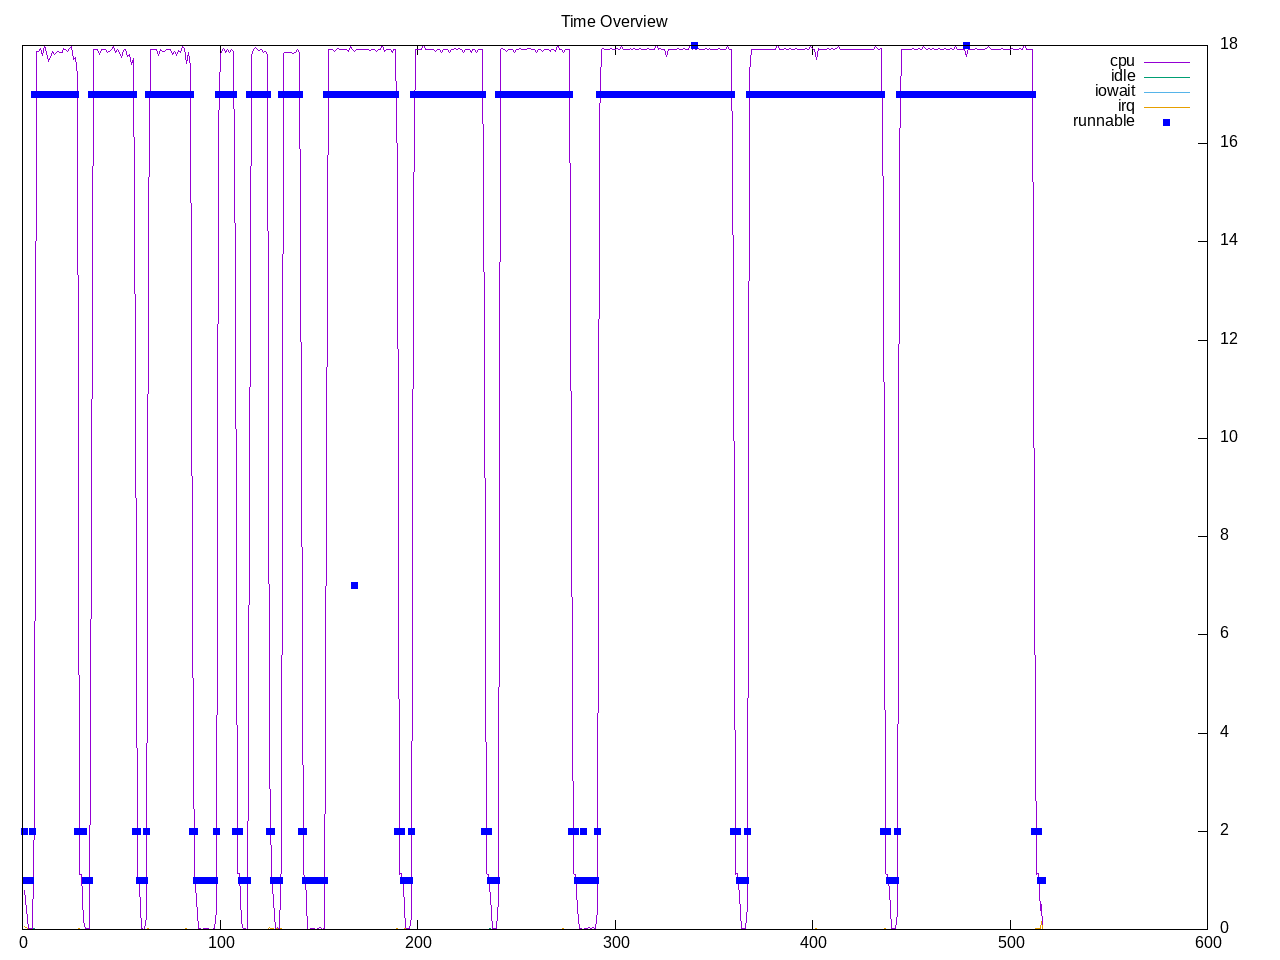
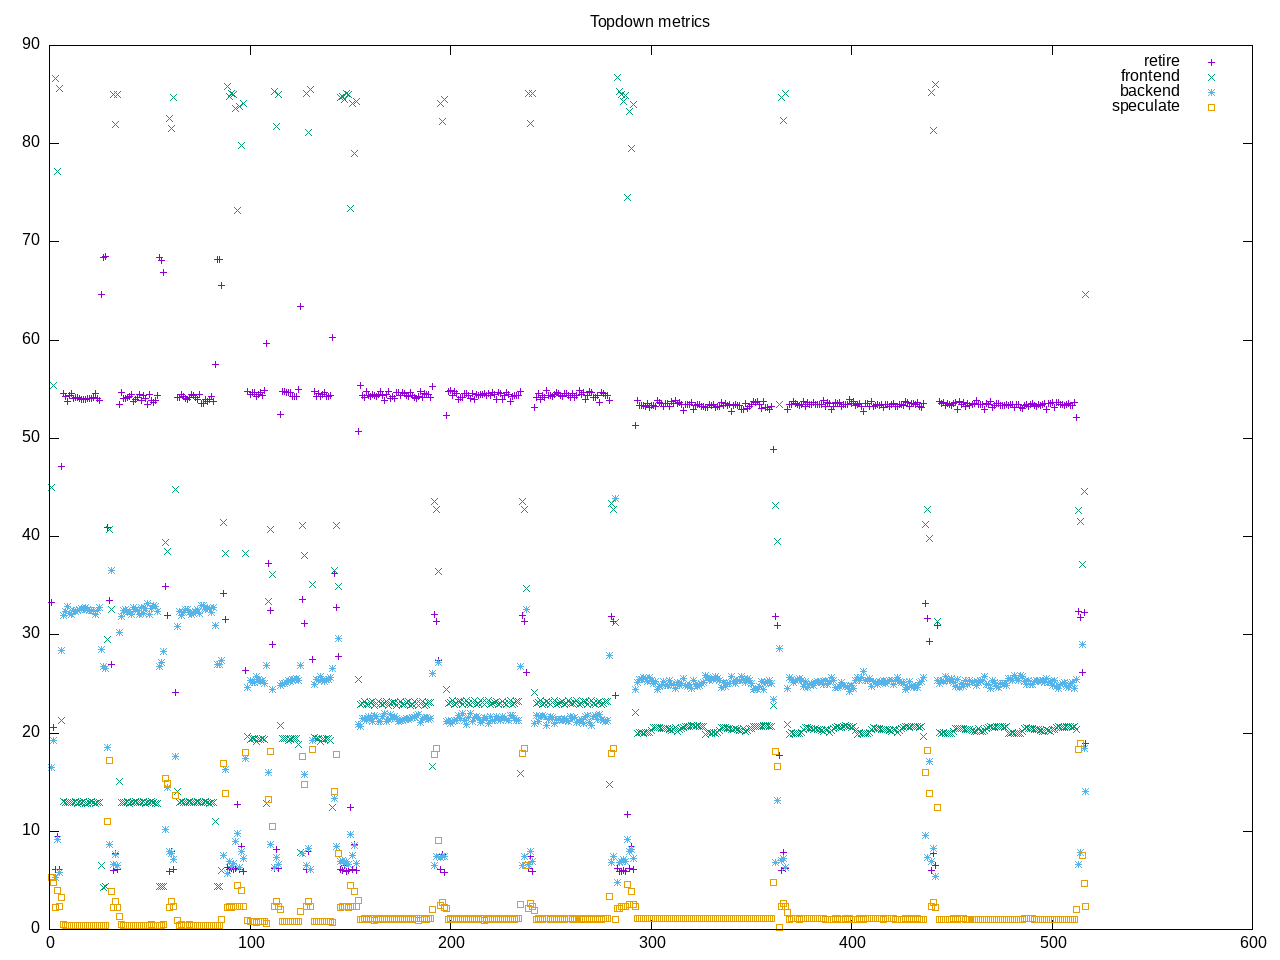
ASTC encoder doing both encoding and decoding. There are four workloads with different encode settings.
Topdown profile shows a high retirement rate with backend stalls and frontend stalls changing some by workload.
AMD metrics a lot of floating point and relatively low L2 access.
elapsed              516.788
on_cpu               0.795          # 12.72 / 16 cores
utime                6565.977
stime                6.691
nvcsw                11724          # 11.71%
nivcsw               88402          # 88.29%
inblock              0              # 0.00/sec
onblock              733904         # 1420.13/sec
cpu-clock            6587278481382  # 6587.278 seconds
task-clock           6587335905427  # 6587.336 seconds
page faults          1895236        # 287.709/sec
context switches     102432         # 15.550/sec
cpu migrations       1655           # 0.251/sec
major page faults    2              # 0.000/sec
minor page faults    1895234        # 287.709/sec
alignment faults     0              # 0.000/sec
emulation faults     0              # 0.000/sec
branches             1984788977011  # 55.516 branches per 1000 inst
branch misses        35322383228    # 1.78% branch miss
conditional          1786077491888  # 49.958 conditional branches per 1000 inst
indirect             4240505356     # 0.119 indirect branches per 1000 inst
cpu-cycles           25693830621900 # 3.11 GHz
instructions         35705494385797 # 1.39 IPC
slots                51621364363374 #
retiring             19006066855327 # 36.8% (54.0%)
-- ucode             176927047233   #     0.3%
-- fastpath          18829139808094 #    36.5%
frontend             6995059072211  # 13.6% (19.9%)
-- latency           6786744700704  #    13.1%
-- bandwidth         208314371507   #     0.4%
backend              8827395238913  # 17.1% (25.1%)
-- cpu               7624454215155  #    14.8%
-- memory            1202941023758  #     2.3%
speculation          372063736871   #  0.7% ( 1.1%)
-- branch mispredict 368100409350   #     0.7%
-- pipeline restart  3963327521     #     0.0%
smt-contention       16420749718088 # 31.8% ( 0.0%)
cpu-cycles           25718683077443 # 3.10 GHz
instructions         35671503486601 # 1.39 IPC
instructions         11924446164926 # 14.974 l2 access per 1000 inst
l2 hit from l1       156742650154   # 6.54% l2 miss
l2 miss from l1      6711981682     #
l2 hit from l2 pf    16851909912    #
l3 hit from l2 pf    4467774002     #
l3 miss from l2 pf   493179304      #
instructions         11911659524416 # 450.784 float per 1000 inst
float 512            45             # 0.000 AVX-512 per 1000 inst
float 256            410            # 0.000 AVX-256 per 1000 inst
float 128            5369581741491  # 450.784 AVX-128 per 1000 inst
float MMX            0              # 0.000 MMX per 1000 inst
float scalar         0              # 0.000 scalar per 1000 inst
instructions         2652042        #
opcache              975668         # 367.893 opcache per 1000 inst
opcache miss         524462         # 53.8% opcache miss rate
l1 dTLB miss         5625           # 2.121 L1 dTLB per 1000 inst
l2 dTLB miss         1138           # 0.429 L2 dTLB per 1000 inst
instructions         2682386        #
icache               1314716        # 490.129 icache per 1000 inst
icache miss          112304         #  8.5% icache miss rate
l1 iTLB miss         12             # 0.004 L1 iTLB per 1000 inst
l2 iTLB miss         0              # 0.000 L2 iTLB per 1000 inst
tlb flush            19             # 0.007 TLB flush per 1000 inst
Intel metrics
elapsed              728.305
on_cpu               0.838          # 13.41 / 16 cores
utime                9762.031
stime                5.245
nvcsw                12570          # 10.96%
nivcsw               102172         # 89.04%
inblock              41560          # 57.06/sec
onblock              722624         # 992.20/sec
cpu-clock            9780538310498  # 9780.538 seconds
task-clock           9780576896522  # 9780.577 seconds
page faults          1881464        # 192.367/sec
context switches     117838         # 12.048/sec
cpu migrations       3274           # 0.335/sec
major page faults    10             # 0.001/sec
minor page faults    1881454        # 192.366/sec
alignment faults     0              # 0.000/sec
emulation faults     0              # 0.000/sec
branches             1983363120229  # 55.477 branches per 1000 inst
branch misses        45953695711    # 2.32% branch miss
conditional          1983363599909  # 55.477 conditional branches per 1000 inst
indirect             451720544818   # 12.635 indirect branches per 1000 inst
slots                47669514571232 #
retiring             28083200512637 # 58.9% (58.9%) high
-- ucode             5470434164301  #    11.5%
-- fastpath          22612766348336 #    47.4%
frontend             12066471484638 # 25.3% (25.3%)
-- latency           9275333680799  #    19.5%
-- bandwidth         2791137803839  #     5.9%
backend              5201850758995  # 10.9% (10.9%) low
-- cpu               4149275756514  #     8.7%
-- memory            1052575002481  #     2.2%
speculation          2342704926128  #  4.9% ( 4.9%)
-- branch mispredict 2324136467288  #     4.9%
-- pipeline restart  18568458840    #     0.0%
smt-contention       0              #  0.0% ( 0.0%)
cpu-cycles           17808128614553 # 1.53 GHz
instructions         26843281855229 # 1.51 IPC
l2 access            439669313013   # 18.599 l2 access per 1000 inst
l2 miss              80659863636    # 18.35% l2 miss
cpu-cycles           15678325923933 # 13.0% memory latency
load stalls          2028612957217  #  9.1% l1 bound
l1 miss              606377070378   #  3.4% l2 bound
l2 miss              66744825283    #  0.4% l3 bound
l3 miss              6195120582     #  0.0% dram bound
store_stalls         4857894264     #  0.0% store bound
Process overview shows many invocations of astenc-avx2
14970 processes
	14604 astcenc-avx2         3637052.49  5886.00
	 68 clinfo                  16.21     6.32
	 38 vulkaninfo               0.94     1.35
	  6 php                      0.14     0.08
	  6 glxinfo:gdrv0            0.11     0.07
	  6 glxinfo:gl0              0.11     0.07
	  4 vulkani:disk$0           0.10     0.14
	  6 clang                    0.05     0.07
	  2 llvmpipe-0               0.05     0.07
	  2 llvmpipe-1               0.05     0.07
	  2 llvmpipe-10              0.05     0.07
	  2 llvmpipe-11              0.05     0.07
	  2 llvmpipe-12              0.05     0.07
	  2 llvmpipe-13              0.05     0.07
	  2 llvmpipe-14              0.05     0.07
	  2 llvmpipe-15              0.05     0.07
	  2 llvmpipe-2               0.05     0.07
	  2 llvmpipe-3               0.05     0.07
	  2 llvmpipe-4               0.05     0.07
	  2 llvmpipe-5               0.05     0.07
	  2 llvmpipe-6               0.05     0.07
	  2 llvmpipe-7               0.05     0.07
	  2 llvmpipe-8               0.05     0.07
	  2 llvmpipe-9               0.05     0.07
	  2 glxinfo                  0.05     0.03
	  2 glxinfo:cs0              0.05     0.03
	  2 glxinfo:disk$0           0.05     0.03
	  2 glxinfo:sh0              0.05     0.03
	  2 glxinfo:shlo0            0.05     0.03
	  1 lspci                    0.01     0.01
	 88 sh                       0.00     0.00
	 13 gcc                      0.00     0.00
	 12 astcenc                  0.00     0.00
	 11 gsettings                0.00     0.00
	  8 stat                     0.00     0.00
	  8 systemd-detect-          0.00     0.00
	  6 llvm-link                0.00     0.00
	  5 phoronix-test-s          0.00     0.00
	  3 gmain                    0.00     0.00
	  3 rocminfo                 0.00     0.00
	  2 cc                       0.00     0.00
	  2 dconf worker             0.00     0.00
	  2 lscpu                    0.00     0.00
	  2 uname                    0.00     0.00
	  2 which                    0.00     0.00
	  2 xset                     0.00     0.00
	  1 date                     0.00     0.00
	  1 dirname                  0.00     0.00
	  1 dmesg                    0.00     0.00
	  1 dmidecode                0.00     0.00
	  1 grep                     0.00     0.00
	  1 ifconfig                 0.00     0.00
	  1 ip                       0.00     0.00
	  1 lsmod                    0.00     0.00
	  1 mktemp                   0.00     0.00
	  1 ps                       0.00     0.00
	  1 qdbus                    0.00     0.00
	  1 readlink                 0.00     0.00
	  1 realpath                 0.00     0.00
	  1 sed                      0.00     0.00
	  1 sort                     0.00     0.00
	  1 stty                     0.00     0.00
	  1 systemctl                0.00     0.00
	  1 template.sh              0.00     0.00
	  1 wc                       0.00     0.00
	  1 xrandr                   0.00     0.00
0 processes running
47 maximum processes