
Testing the AOMedia libavif encoding of a JPEG image to AV1 Image Format (AVIF). There are five workloads with the first ones taking longer and the later ones quicker.

Overall a moderate retirement rate that is gated by frontend latency more than other areas.
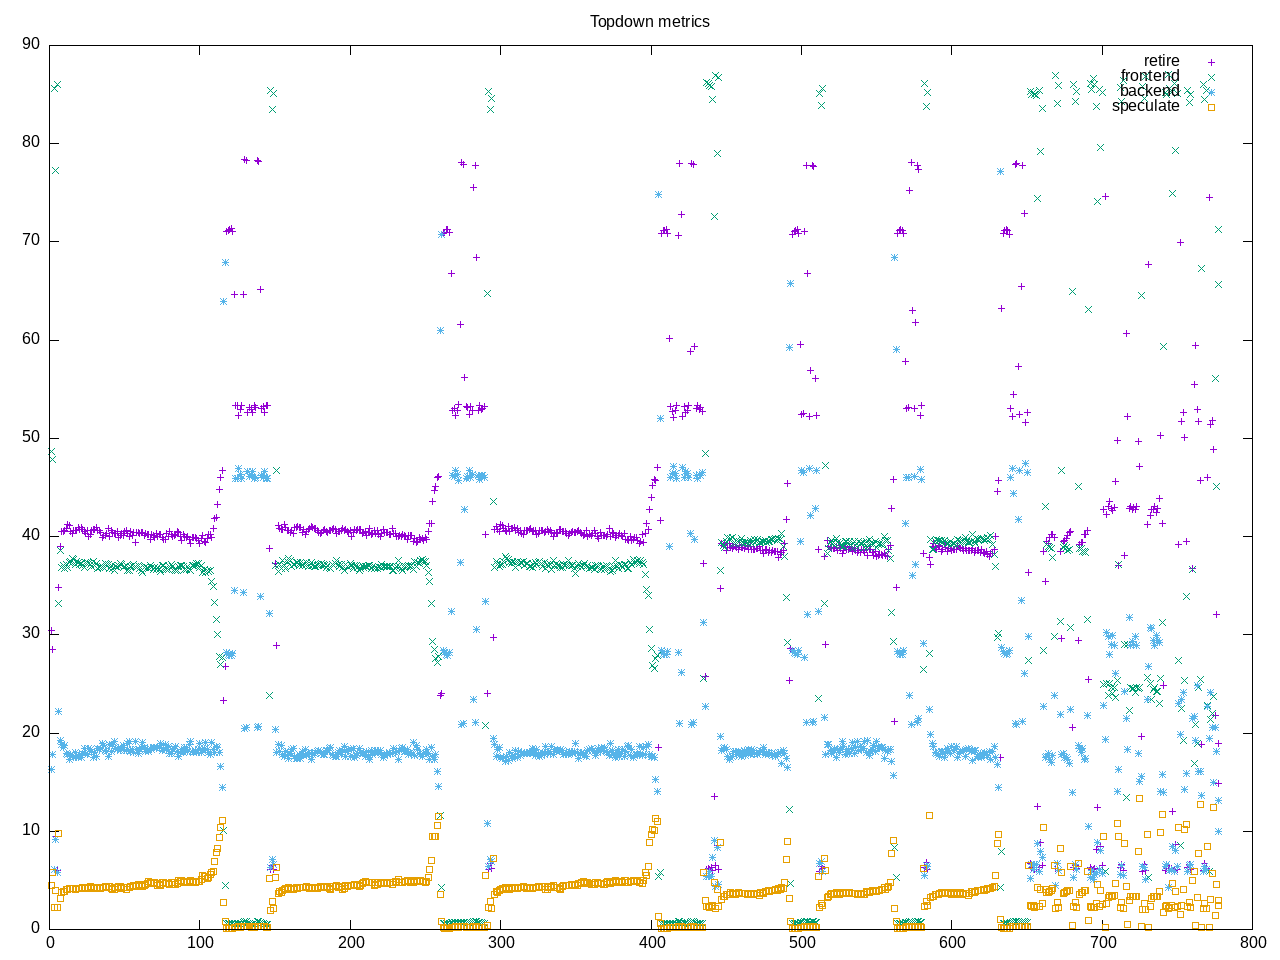
AMD metrics show a moderate floating point and some L2 access but not much beyond L2.
elapsed              776.030
on_cpu               0.646          # 10.33 / 16 cores
utime                7988.946
stime                29.236
nvcsw                8249           # 9.62%
nivcsw               77530          # 90.38%
inblock              48             # 0.06/sec
onblock              2390352        # 3080.23/sec
cpu-clock            8018509489294  # 8018.509 seconds
task-clock           8018569834006  # 8018.570 seconds
page faults          14178882       # 1768.256/sec
context switches     89454          # 11.156/sec
cpu migrations       853            # 0.106/sec
major page faults    6              # 0.001/sec
minor page faults    14178876       # 1768.255/sec
alignment faults     0              # 0.000/sec
emulation faults     0              # 0.000/sec
branches             4999746488897  # 88.461 branches per 1000 inst
branch misses        183057751032   # 3.66% branch miss
conditional          3993200127251  # 70.652 conditional branches per 1000 inst
indirect             131442769397   # 2.326 indirect branches per 1000 inst
cpu-cycles           31496871284503 # 2.53 GHz
instructions         56521896350795 # 1.79 IPC
slots                62999784287940 #
retiring             19017089379488 # 30.2% (40.8%)
-- ucode             27844082154    #     0.0%
-- fastpath          18989245297334 #    30.1%
frontend             16572601697641 # 26.3% (35.6%)
-- latency           11800440778260 #    18.7%
-- bandwidth         4772160919381  #     7.6%
backend              8950046575799  # 14.2% (19.2%)
-- cpu               2128369509241  #     3.4%
-- memory            6821677066558  #    10.8%
speculation          2041783535763  #  3.2% ( 4.4%)
-- branch mispredict 2027861096394  #     3.2%
-- pipeline restart  13922439369    #     0.0%
smt-contention       16418232029740 # 26.1% ( 0.0%)
cpu-cycles           31502845615599 # 2.53 GHz
instructions         56531672686501 # 1.79 IPC
instructions         18842407946560 # 42.197 l2 access per 1000 inst
l2 hit from l1       760501763207   # 1.67% l2 miss
l2 miss from l1      6393162262     #
l2 hit from l2 pf    27683711157    #
l3 hit from l2 pf    5594154536     #
l3 miss from l2 pf   1307684273     #
instructions         18829007448200 # 147.987 float per 1000 inst
float 512            63             # 0.000 AVX-512 per 1000 inst
float 256            358            # 0.000 AVX-256 per 1000 inst
float 128            2786445041761  # 147.987 AVX-128 per 1000 inst
float MMX            0              # 0.000 MMX per 1000 inst
float scalar         15968          # 0.000 scalar per 1000 inst
Intel metrics
elapsed              956.784
on_cpu               0.665          # 10.65 / 16 cores
utime                10165.201
stime                22.171
nvcsw                7196           # 8.21%
nivcsw               80461          # 91.79%
inblock              57248          # 59.83/sec
onblock              2379104        # 2486.56/sec
cpu-clock            10187609455299 # 10187.609 seconds
task-clock           10187653273451 # 10187.653 seconds
page faults          14163058       # 1390.218/sec
context switches     92244          # 9.054/sec
cpu migrations       1442           # 0.142/sec
major page faults    336            # 0.033/sec
minor page faults    14162722       # 1390.185/sec
alignment faults     0              # 0.000/sec
emulation faults     0              # 0.000/sec
branches             5009193900823  # 88.583 branches per 1000 inst
branch misses        199137122570   # 3.98% branch miss
conditional          5009193921015  # 88.583 conditional branches per 1000 inst
indirect             1467672076348  # 25.954 indirect branches per 1000 inst
slots                53403197834060 #
retiring             29484351019190 # 55.2% (55.2%)
-- ucode             1741320683354  #     3.3%
-- fastpath          27743030335836 #    52.0%
frontend             14595687311600 # 27.3% (27.3%)
-- latency           5657081227319  #    10.6%
-- bandwidth         8938606084281  #    16.7%
backend              3226373489203  #  6.0% ( 6.0%)
-- cpu               2198382173669  #     4.1%
-- memory            1027991315534  #     1.9%
speculation          6392542097180  # 12.0% (12.0%)
-- branch mispredict 6291794118001  #    11.8%
-- pipeline restart  100747979179   #     0.2%
smt-contention       0              #  0.0% ( 0.0%)
cpu-cycles           30333382233266 # 1.98 GHz
instructions         54496813365970 # 1.80 IPC
l2 access            1080131034156  # 36.968 l2 access per 1000 inst
l2 miss              29894399020    # 2.77% l2 miss
Process structure
605 processes
	 30 avifenc               7972.69    28.53
	 68 clinfo                  16.12     6.32
	 38 vulkaninfo               1.33     0.95
	225 aom enc worker           0.30     0.00
	  4 vulkani:disk$0           0.14     0.10
	  6 php                      0.12     0.12
	  6 glxinfo:gdrv0            0.12     0.10
	  6 clang                    0.07     0.05
	  2 llvmpipe-0               0.07     0.05
	  2 llvmpipe-1               0.07     0.05
	  2 llvmpipe-10              0.07     0.05
	  2 llvmpipe-11              0.07     0.05
	  2 llvmpipe-12              0.07     0.05
	  2 llvmpipe-13              0.07     0.05
	  2 llvmpipe-14              0.07     0.05
	  2 llvmpipe-15              0.07     0.05
	  2 llvmpipe-2               0.07     0.05
	  2 llvmpipe-3               0.07     0.05
	  2 llvmpipe-4               0.07     0.05
	  2 llvmpipe-5               0.07     0.05
	  2 llvmpipe-6               0.07     0.05
	  2 llvmpipe-7               0.07     0.05
	  2 llvmpipe-8               0.07     0.05
	  2 llvmpipe-9               0.07     0.05
	  2 glxinfo                  0.06     0.04
	  2 glxinfo:cs0              0.06     0.04
	  2 glxinfo:disk$0           0.06     0.04
	  2 glxinfo:sh0              0.06     0.04
	  2 glxinfo:shlo0            0.06     0.04
	  3 rocminfo                 0.03     0.00
	  1 lspci                    0.00     0.02
	  1 ps                       0.00     0.01
	 90 sh                       0.00     0.00
	 13 gcc                      0.00     0.00
	 12 gsettings                0.00     0.00
	  8 stat                     0.00     0.00
	  8 systemd-detect-          0.00     0.00
	  6 llvm-link                0.00     0.00
	  5 phoronix-test-s          0.00     0.00
	  3 gmain                    0.00     0.00
	  2 cc                       0.00     0.00
	  2 lscpu                    0.00     0.00
	  2 uname                    0.00     0.00
	  2 which                    0.00     0.00
	  2 xset                     0.00     0.00
	  1 date                     0.00     0.00
	  1 dconf worker             0.00     0.00
	  1 dirname                  0.00     0.00
	  1 dmesg                    0.00     0.00
	  1 dmidecode                0.00     0.00
	  1 grep                     0.00     0.00
	  1 ifconfig                 0.00     0.00
	  1 ip                       0.00     0.00
	  1 lsmod                    0.00     0.00
	  1 mktemp                   0.00     0.00
	  1 qdbus                    0.00     0.00
	  1 readlink                 0.00     0.00
	  1 realpath                 0.00     0.00
	  1 sed                      0.00     0.00
	  1 sort                     0.00     0.00
	  1 stty                     0.00     0.00
	  1 systemctl                0.00     0.00
	  1 template.sh              0.00     0.00
	  1 wc                       0.00     0.00
	  1 xrandr                   0.00     0.00
0 processes running
47 maximum processes
Straightforward process structure with workers on each core.
      93101) avifenc          cpu=14 start=6.01  finish=144.91
        93102) avifenc          cpu=8 start=6.01  finish=144.90
          93103) aom enc worker   cpu=0 start=6.74  finish=144.84
          93104) aom enc worker   cpu=0 start=6.74  finish=144.84
          93105) aom enc worker   cpu=0 start=6.74  finish=144.84
          93106) aom enc worker   cpu=0 start=6.74  finish=144.84
          93107) aom enc worker   cpu=0 start=6.74  finish=144.84
          93108) aom enc worker   cpu=0 start=6.74  finish=144.84
          93109) aom enc worker   cpu=0 start=6.74  finish=144.84
          93110) aom enc worker   cpu=0 start=6.74  finish=144.84
          93111) aom enc worker   cpu=0 start=6.74  finish=144.84
          93112) aom enc worker   cpu=0 start=6.74  finish=144.84
          93113) aom enc worker   cpu=0 start=6.74  finish=144.84
          93114) aom enc worker   cpu=0 start=6.74  finish=144.84
          93115) aom enc worker   cpu=0 start=6.74  finish=144.84
          93116) aom enc worker   cpu=0 start=6.74  finish=144.84
          93117) aom enc worker   cpu=0 start=6.74  finish=144.84