
blake2 is a crypto alternative to MD5 and SHA2/3. There is one test and it runs very quickly. Everything in 18 seconds
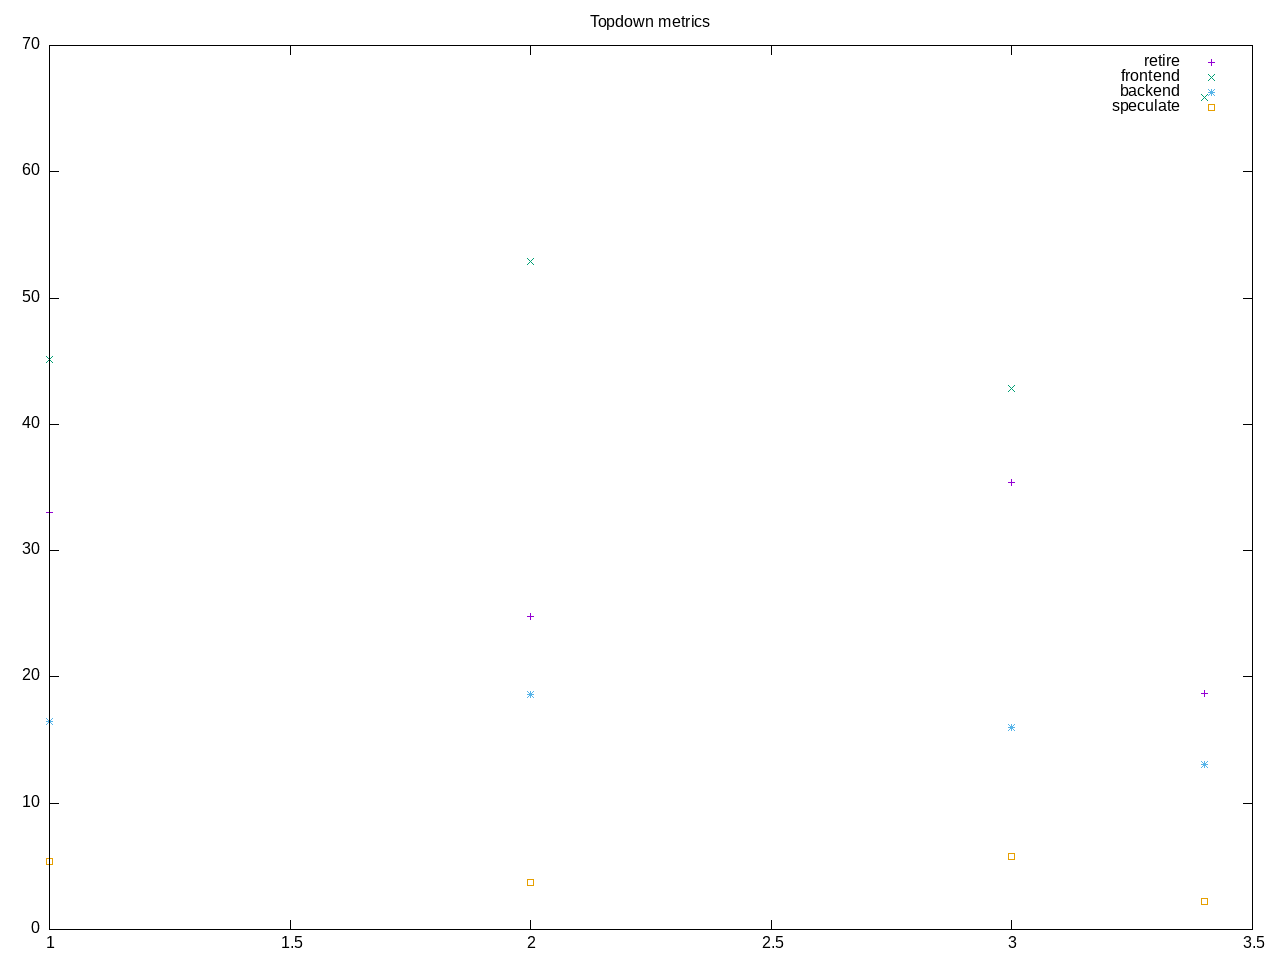
Topdown doesn’t give enough data points to be interesting.
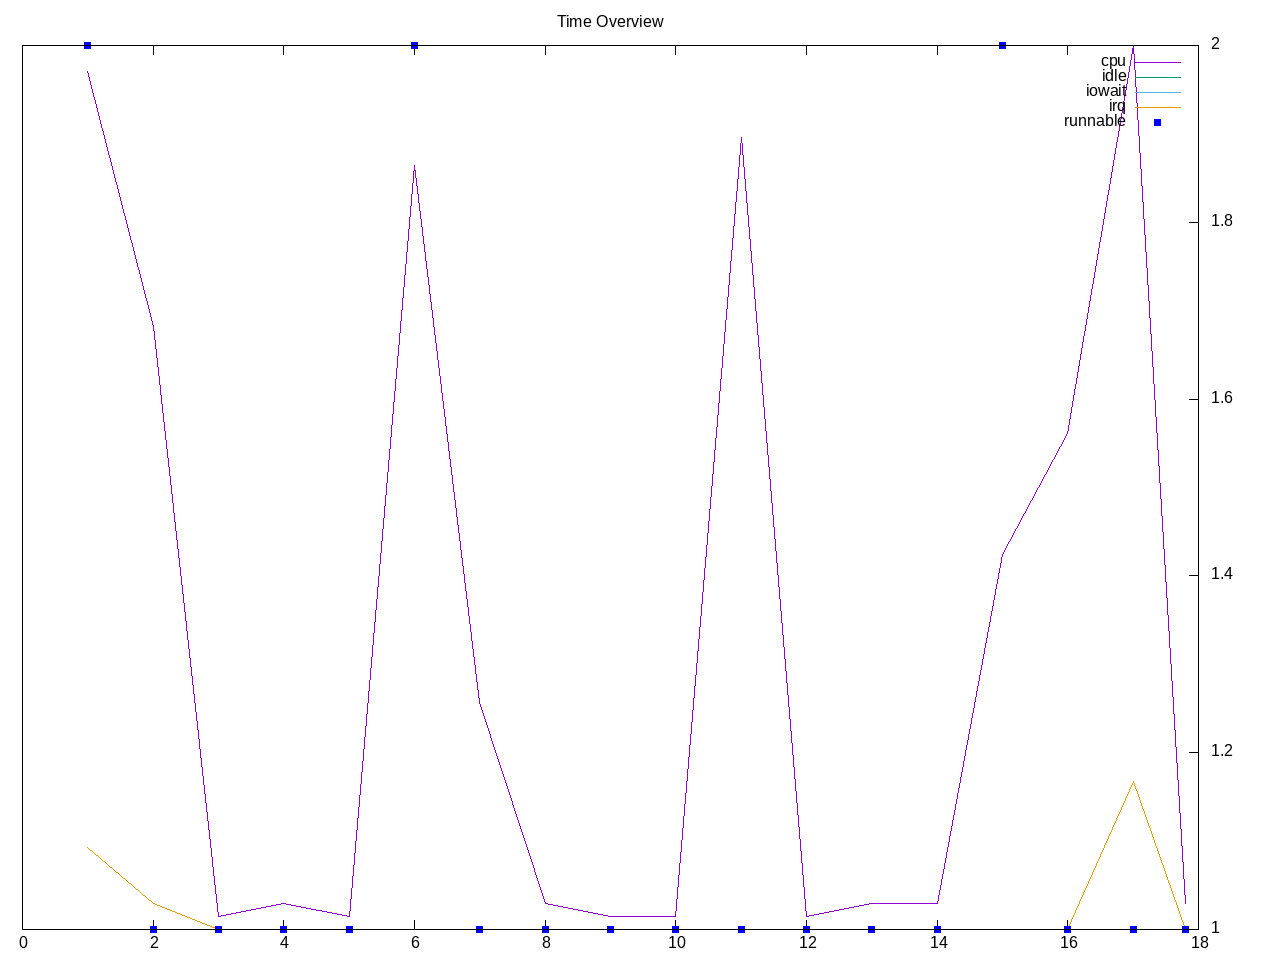
AMD metrics confirm less than 0.25 of a core. Given the quick runtime some of these will have large variance.
elapsed              18.217
on_cpu               0.012          # 0.20 / 16 cores
utime                2.829
stime                0.809
nvcsw                1997           # 82.25%
nivcsw               431            # 17.75%
inblock              0              # 0.00/sec
onblock              12568          # 689.89/sec
cpu-clock            3652210663     # 3.652 seconds
task-clock           3654667751     # 3.655 seconds
page faults          146960         # 40211.590/sec
context switches     2343           # 641.098/sec
cpu migrations       252            # 68.953/sec
major page faults    2              # 0.547/sec
minor page faults    146958         # 40211.042/sec
alignment faults     0              # 0.000/sec
emulation faults     0              # 0.000/sec
branches             1925133462     # 111.763 branches per 1000 inst
branch misses        75108029       # 3.90% branch miss
conditional          1253682827     # 72.782 conditional branches per 1000 inst
indirect             48540116       # 2.818 indirect branches per 1000 inst
cpu-cycles           4271127161     # 0.08 GHz
instructions         8197281049     # 1.92 IPC
slots                9518953572     #
retiring             2937855969     # 30.9% (30.9%)
-- ucode             8066347        #     0.1%
-- fastpath          2929789622     #    30.8%
frontend             4455054076     # 46.8% (46.9%) high
-- latency           3428611128     #    36.0%
-- bandwidth         1026442948     #    10.8%
backend              1641986612     # 17.2% (17.3%) low
-- cpu               267262731      #     2.8%
-- memory            1374723881     #    14.4%
speculation          472121254      #  5.0% ( 5.0%)
-- branch mispredict 467125922      #     4.9%
-- pipeline restart  4995332        #     0.1%
smt-contention       11706067       #  0.1% ( 0.0%)
cpu-cycles           4186759574     # 0.08 GHz
instructions         8276096679     # 1.98 IPC
instructions         2941668691     # 34.044 l2 access per 1000 inst
l2 hit from l1       83962542       # 18.64% l2 miss
l2 miss from l1      10031346       #
l2 hit from l2 pf    7548860        #
l3 hit from l2 pf    3708030        #
l3 miss from l2 pf   4927792        #
instructions         2938636863     # 13.305 float per 1000 inst
float 512            33             # 0.000 AVX-512 per 1000 inst
float 256            16             # 0.000 AVX-256 per 1000 inst
float 128            39098678       # 13.305 AVX-128 per 1000 inst
float MMX            0              # 0.000 MMX per 1000 inst
float scalar         0              # 0.000 scalar per 1000 inst
instructions         2667718        #
opcache              999256         # 374.573 opcache per 1000 inst
opcache miss         539651         # 54.0% opcache miss rate
l1 dTLB miss         5231           # 1.961 L1 dTLB per 1000 inst
l2 dTLB miss         1112           # 0.417 L2 dTLB per 1000 inst
instructions         2696632        #
icache               1329318        # 492.955 icache per 1000 inst
icache miss          115047         #  8.7% icache miss rate
l1 iTLB miss         13             # 0.005 L1 iTLB per 1000 inst
l2 iTLB miss         0              # 0.000 L2 iTLB per 1000 inst
tlb flush            19             # 0.007 TLB flush per 1000 inst
Intel metrics
elapsed              15.968
on_cpu               0.010          # 0.16 / 16 cores
utime                2.220
stime                0.354
nvcsw                1774           # 93.76%
nivcsw               118            # 6.24%
inblock              112            # 7.01/sec
onblock              1264           # 79.16/sec
cpu-clock            2580927898     # 2.581 seconds
task-clock           2583053059     # 2.583 seconds
page faults          135868         # 52599.771/sec
context switches     1799           # 696.463/sec
cpu migrations       234            # 90.590/sec
major page faults    3              # 1.161/sec
minor page faults    135865         # 52598.610/sec
alignment faults     0              # 0.000/sec
emulation faults     0              # 0.000/sec
branches             1625570992     # 102.545 branches per 1000 inst
branch misses        19043958       # 1.17% branch miss
conditional          1625582928     # 102.545 conditional branches per 1000 inst
indirect             48884031       # 3.084 indirect branches per 1000 inst
slots                19603652576    #
retiring             7249074069     # 37.0% (37.0%)
-- ucode             631164105      #     3.2%
-- fastpath          6617909964     #    33.8%
frontend             5624336959     # 28.7% (28.7%)
-- latency           2694991000     #    13.7%
-- bandwidth         2929345959     #    14.9%
backend              4502057955     # 23.0% (23.0%)
-- cpu               1875569336     #     9.6%
-- memory            2626488619     #    13.4%
speculation          2242365031     # 11.4% (11.4%) high
-- branch mispredict 2120900191     #    10.8%
-- pipeline restart  121464840      #     0.6%
smt-contention       0              #  0.0% ( 0.0%)
cpu-cycles           3338619990     # 0.09 GHz
instructions         7455339080     # 2.23 IPC
l2 access            223930695      # 30.114 l2 access per 1000 inst
l2 miss              67819500       # 30.29% l2 miss
cpu-cycles           3318259338     # 20.6% memory latency
load stalls          611490716      #  1.3% l1 bound
l1 miss              568002941      #  8.8% l2 bound
l2 miss              275638797      #  2.3% l3 bound
l3 miss              199388104      #  6.0% dram bound
store_stalls         73518241       #  2.2% store bound
Process overview is mostly test overhead
299 processes
	 68 clinfo                  18.54     8.10
	 38 vulkaninfo               1.15     1.15
	  6 glxinfo:gdrv0            0.14     0.06
	  6 glxinfo:gl0              0.14     0.06
	  4 vulkani:disk$0           0.13     0.12
	  2 llvmpipe-0               0.07     0.06
	  2 llvmpipe-1               0.07     0.06
	  2 llvmpipe-10              0.07     0.06
	  2 llvmpipe-11              0.07     0.06
	  2 llvmpipe-12              0.07     0.06
	  2 llvmpipe-13              0.07     0.06
	  2 llvmpipe-14              0.07     0.06
	  2 llvmpipe-15              0.07     0.06
	  2 llvmpipe-2               0.07     0.06
	  2 llvmpipe-3               0.07     0.06
	  2 llvmpipe-4               0.07     0.06
	  2 llvmpipe-5               0.07     0.06
	  2 llvmpipe-6               0.07     0.06
	  2 llvmpipe-7               0.07     0.06
	  2 llvmpipe-8               0.07     0.06
	  2 llvmpipe-9               0.07     0.06
	  2 glxinfo                  0.07     0.03
	  2 glxinfo:cs0              0.07     0.03
	  2 glxinfo:disk$0           0.07     0.03
	  2 glxinfo:sh0              0.07     0.03
	  2 glxinfo:shlo0            0.07     0.03
	  6 php                      0.06     0.04
	  3 clang                    0.04     0.02
	  3 rocminfo                 0.03     0.00
	  1 lspci                    0.01     0.02
	 57 sh                       0.00     0.00
	  6 gcc                      0.00     0.00
	  6 gsettings                0.00     0.00
	  5 dconf worker             0.00     0.00
	  5 gmain                    0.00     0.00
	  5 phoronix-test-s          0.00     0.00
	  5 stat                     0.00     0.00
	  4 systemd-detect-          0.00     0.00
	  3 llvm-link                0.00     0.00
	  2 lscpu                    0.00     0.00
	  2 uname                    0.00     0.00
	  2 which                    0.00     0.00
	  2 xset                     0.00     0.00
	  1 cc                       0.00     0.00
	  1 date                     0.00     0.00
	  1 dirname                  0.00     0.00
	  1 dmesg                    0.00     0.00
	  1 dmidecode                0.00     0.00
	  1 grep                     0.00     0.00
	  1 ifconfig                 0.00     0.00
	  1 ip                       0.00     0.00
	  1 lsmod                    0.00     0.00
	  1 mktemp                   0.00     0.00
	  1 qdbus                    0.00     0.00
	  1 readlink                 0.00     0.00
	  1 realpath                 0.00     0.00
	  1 sed                      0.00     0.00
	  1 sort                     0.00     0.00
	  1 template.sh              0.00     0.00
	  1 wc                       0.00     0.00
	  1 xrandr                   0.00     0.00
0 processes running
47 maximum processes