
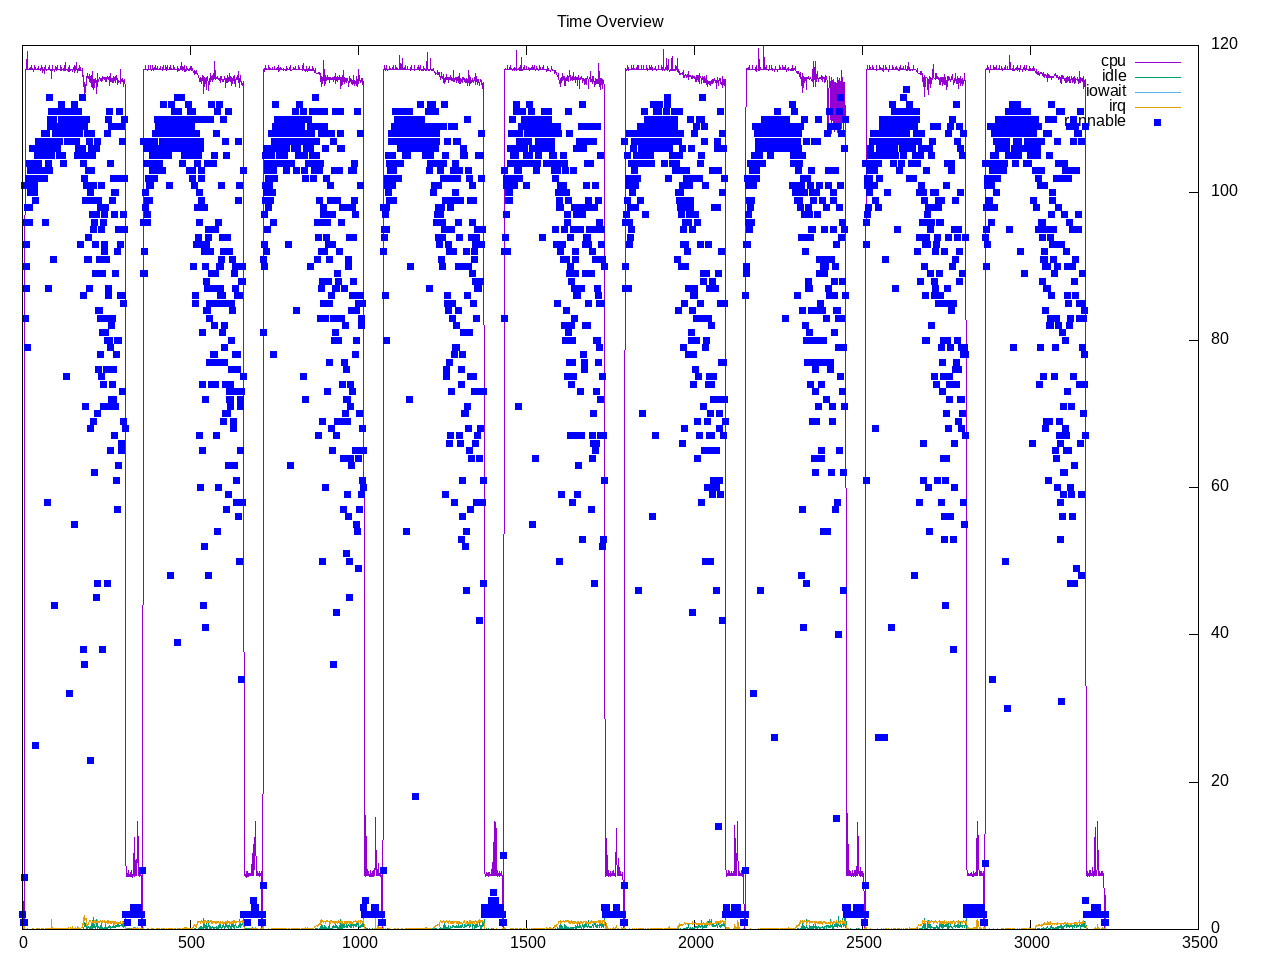
Various file system operations to simulate a server responding to blog type requests. There is a regular pattern of many processes running.
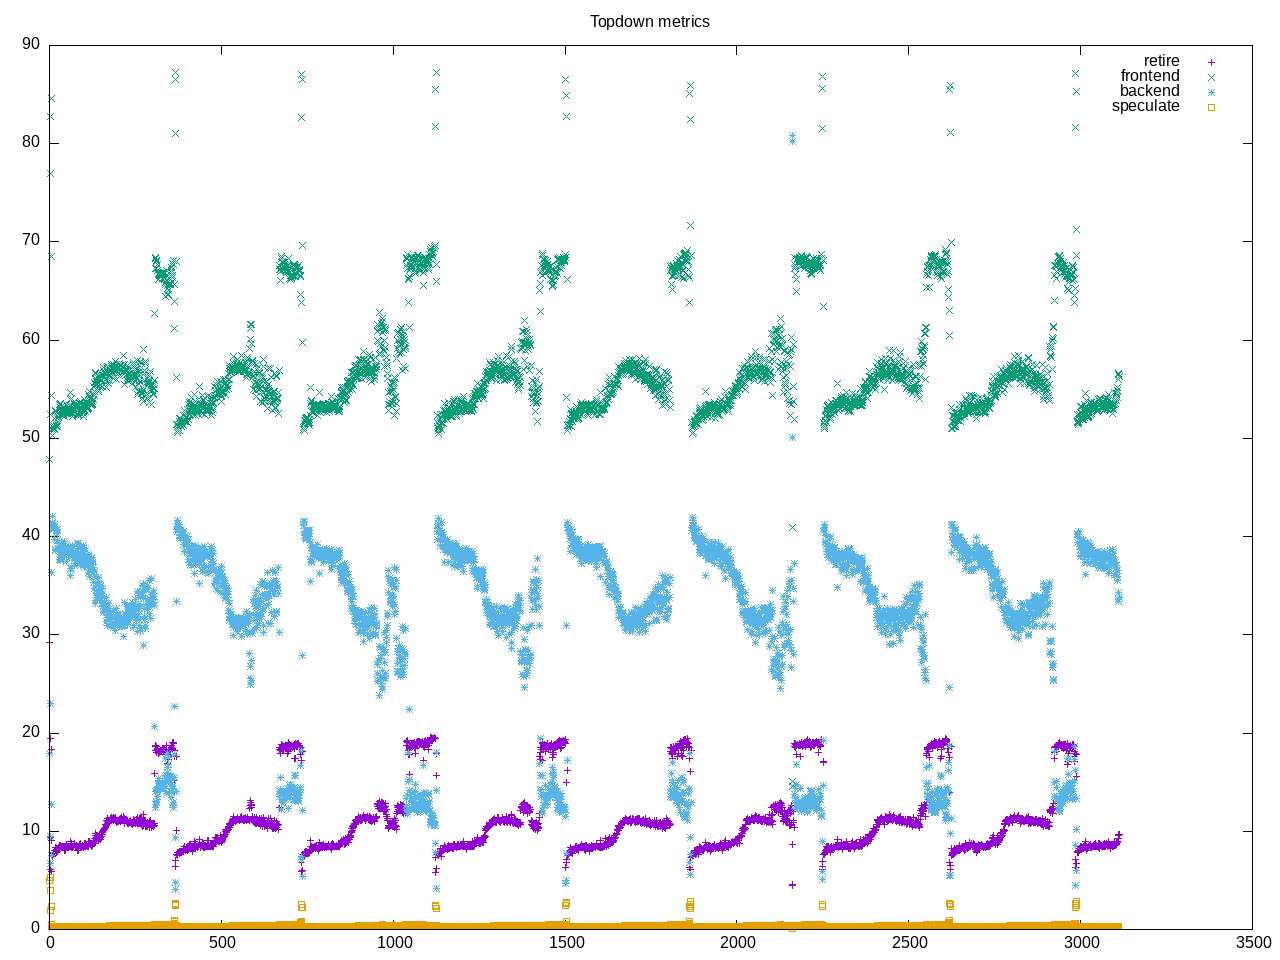
Topdown profile shows 1/5 instructions are branches and a high frontend stall rate and low IPC. Interesting progression as the benchmark proceeds.
AMD metrics
elapsed              1079.623
on_cpu               0.775          # 12.40 / 16 cores
utime                626.479
stime                12757.518
nvcsw                73243125       # 83.01%
nivcsw               14993431       # 16.99%
inblock              2959912896     # 2741618.10/sec
onblock              459798480      # 425888.15/sec
cpu-clock            13419582557960 # 13419.583 seconds
task-clock           13423723045113 # 13423.723 seconds
page faults          154186         # 11.486/sec
context switches     88241810       # 6573.572/sec
cpu migrations       735112         # 54.762/sec
major page faults    1184           # 0.088/sec
minor page faults    153002         # 11.398/sec
alignment faults     0              # 0.000/sec
emulation faults     0              # 0.000/sec
branches             4970850530952  # 204.072 branches per 1000 inst
branch misses        538477710845   # 10.83% branch miss
conditional          2623040629198  # 107.686 conditional branches per 1000 inst
indirect             37891337710    # 1.556 indirect branches per 1000 inst
cpu-cycles           55221583370294 # 3.19 GHz
instructions         24271910195888 # 0.44 IPC low
slots                110237354811972 #
retiring             9825952528094  #  8.9% ( 9.9%) low
-- ucode             74437066062    #     0.1%
-- fastpath          9751515462032  #     8.8%
frontend             54710145602163 # 49.6% (55.1%) high
-- latency           40378446965442 #    36.6%
-- bandwidth         14331698636721 #    13.0%
backend              34371309469125 # 31.2% (34.6%)
-- cpu               6359112678567  #     5.8%
-- memory            28012196790558 #    25.4%
speculation          334336833030   #  0.3% ( 0.3%) low
-- branch mispredict 333511069585   #     0.3%
-- pipeline restart  825763445      #     0.0%
smt-contention       10994435584774 # 10.0% ( 0.0%)
cpu-cycles           55148842595156 # 3.18 GHz
instructions         24193263117001 # 0.44 IPC low
instructions         8039343498228  # 115.461 l2 access per 1000 inst
l2 hit from l1       714674602559   # 26.40% l2 miss
l2 miss from l1      102585058942   #
l2 hit from l2 pf    71109015126    #
l3 hit from l2 pf    73790816609    #
l3 miss from l2 pf   68659563010    #
instructions         8036663877975  # 15.899 float per 1000 inst
float 512            60             # 0.000 AVX-512 per 1000 inst
float 256            638            # 0.000 AVX-256 per 1000 inst
float 128            127776369542   # 15.899 AVX-128 per 1000 inst
float MMX            0              # 0.000 MMX per 1000 inst
float scalar         0              # 0.000 scalar per 1000 inst
This program is too large to fit on my Intel PC with 16 GB of memory. It dies ~two and a half minutes after starting and syslog has an indication of out of memory error
Jan 31 05:19:23 hobart systemd[1483]: vte-spawn-b19b7cc3-12af-4ccb-a307-5a8207114d9f.scope: systemd-oomd killed 120 process(es) in this unit.
Jan 31 05:19:23 hobart systemd[1483]: vte-spawn-b19b7cc3-12af-4ccb-a307-5a8207114d9f.scope: Consumed 23min 48.045s CPU time.
Process overview
1034 processes
	666 blogbench            121278.09 2560639.54
	 68 clinfo                  18.85    13.69
	 12 rm                      11.37   461.20
	 38 vulkaninfo               1.15     2.28
	  6 php                      0.18     0.68
	  4 vulkani:disk$0           0.13     0.24
	  6 glxinfo:gdrv0            0.10     0.10
	  6 glxinfo:gl0              0.10     0.10
	  2 llvmpipe-0               0.07     0.12
	  2 llvmpipe-1               0.07     0.12
	  2 llvmpipe-10              0.07     0.12
	  2 llvmpipe-11              0.07     0.12
	  2 llvmpipe-12              0.07     0.12
	  2 llvmpipe-13              0.07     0.12
	  2 llvmpipe-14              0.07     0.12
	  2 llvmpipe-15              0.07     0.12
	  2 llvmpipe-2               0.07     0.12
	  2 llvmpipe-3               0.07     0.12
	  2 llvmpipe-4               0.07     0.12
	  2 llvmpipe-5               0.07     0.12
	  2 llvmpipe-6               0.07     0.12
	  2 llvmpipe-7               0.07     0.12
	  2 llvmpipe-8               0.07     0.12
	  2 llvmpipe-9               0.07     0.12
	  2 glxinfo                  0.06     0.04
	  2 glxinfo:cs0              0.06     0.04
	  2 glxinfo:disk$0           0.06     0.04
	  2 glxinfo:sh0              0.06     0.04
	  2 glxinfo:shlo0            0.06     0.04
	  6 clang                    0.04     0.08
	  3 rocminfo                 0.03     0.00
	  1 lspci                    0.00     0.03
	  1 ps                       0.00     0.01
	 83 sh                       0.00     0.00
	 13 gcc                      0.00     0.00
	 12 gsettings                0.00     0.00
	  9 stat                     0.00     0.00
	  8 systemd-detect-          0.00     0.00
	  6 llvm-link                0.00     0.00
	  6 mkdir                    0.00     0.00
	  5 phoronix-test-s          0.00     0.00
	  4 gmain                    0.00     0.00
	  2 cc                       0.00     0.00
	  2 lscpu                    0.00     0.00
	  2 uname                    0.00     0.00
	  2 which                    0.00     0.00
	  2 xset                     0.00     0.00
	  1 date                     0.00     0.00
	  1 dirname                  0.00     0.00
	  1 dmesg                    0.00     0.00
	  1 dmidecode                0.00     0.00
	  1 grep                     0.00     0.00
	  1 ifconfig                 0.00     0.00
	  1 ip                       0.00     0.00
	  1 lsmod                    0.00     0.00
	  1 mktemp                   0.00     0.00
	  1 qdbus                    0.00     0.00
	  1 readlink                 0.00     0.00
	  1 realpath                 0.00     0.00
	  1 sed                      0.00     0.00
	  1 sort                     0.00     0.00
	  1 stty                     0.00     0.00
	  1 systemctl                0.00     0.00
	  1 template.sh              0.00     0.00
	  1 wc                       0.00     0.00
	  1 xrandr                   0.00     0.00
0 processes running
120 maximum processes