
bork is a cross-platform file encryption utility written in Java. There is one workload which runs in seconds. Also looks like it is single-threaded
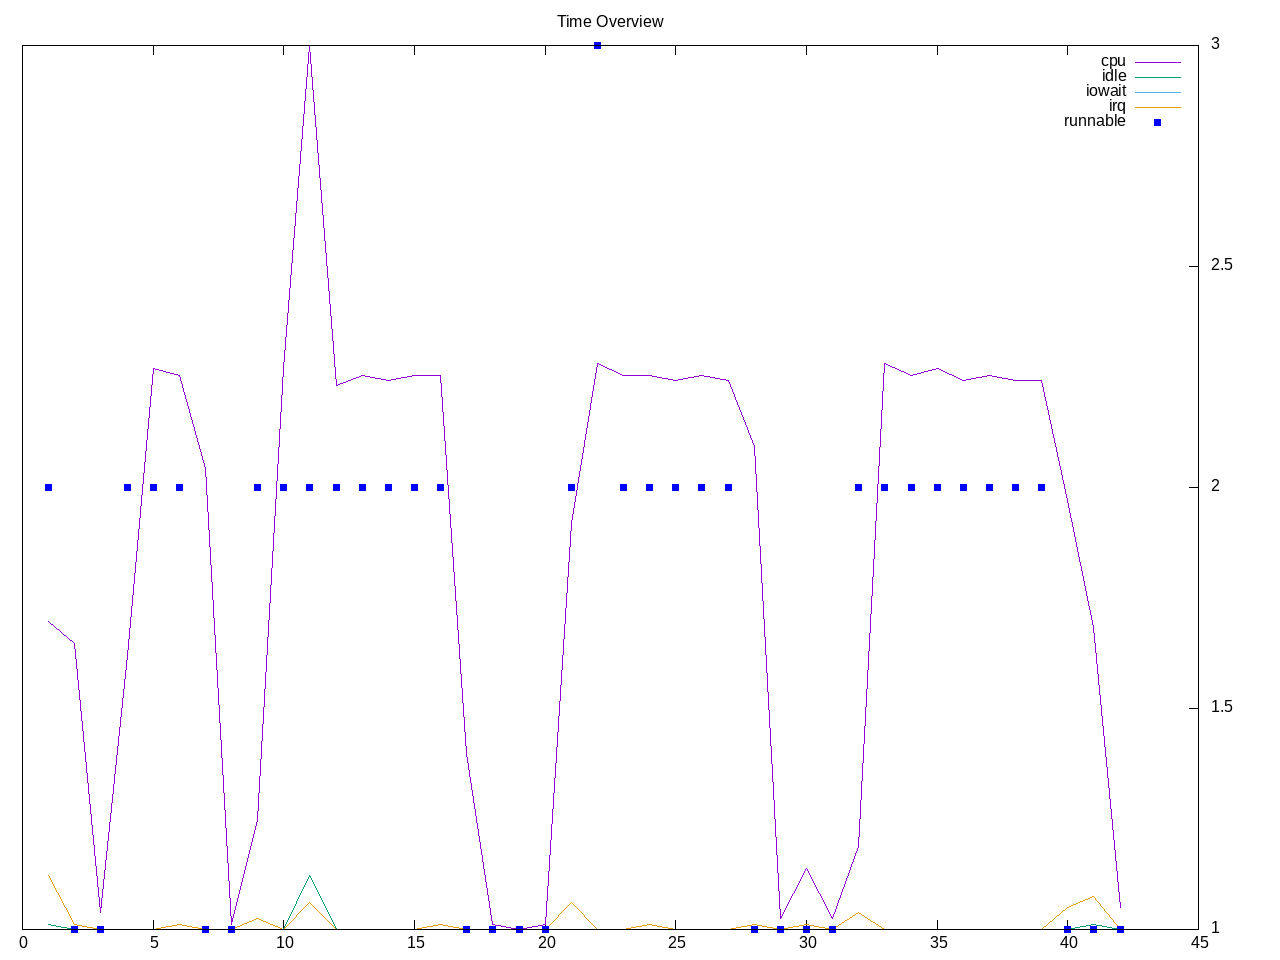
AMD topdown is sparse given how quickly it runs.
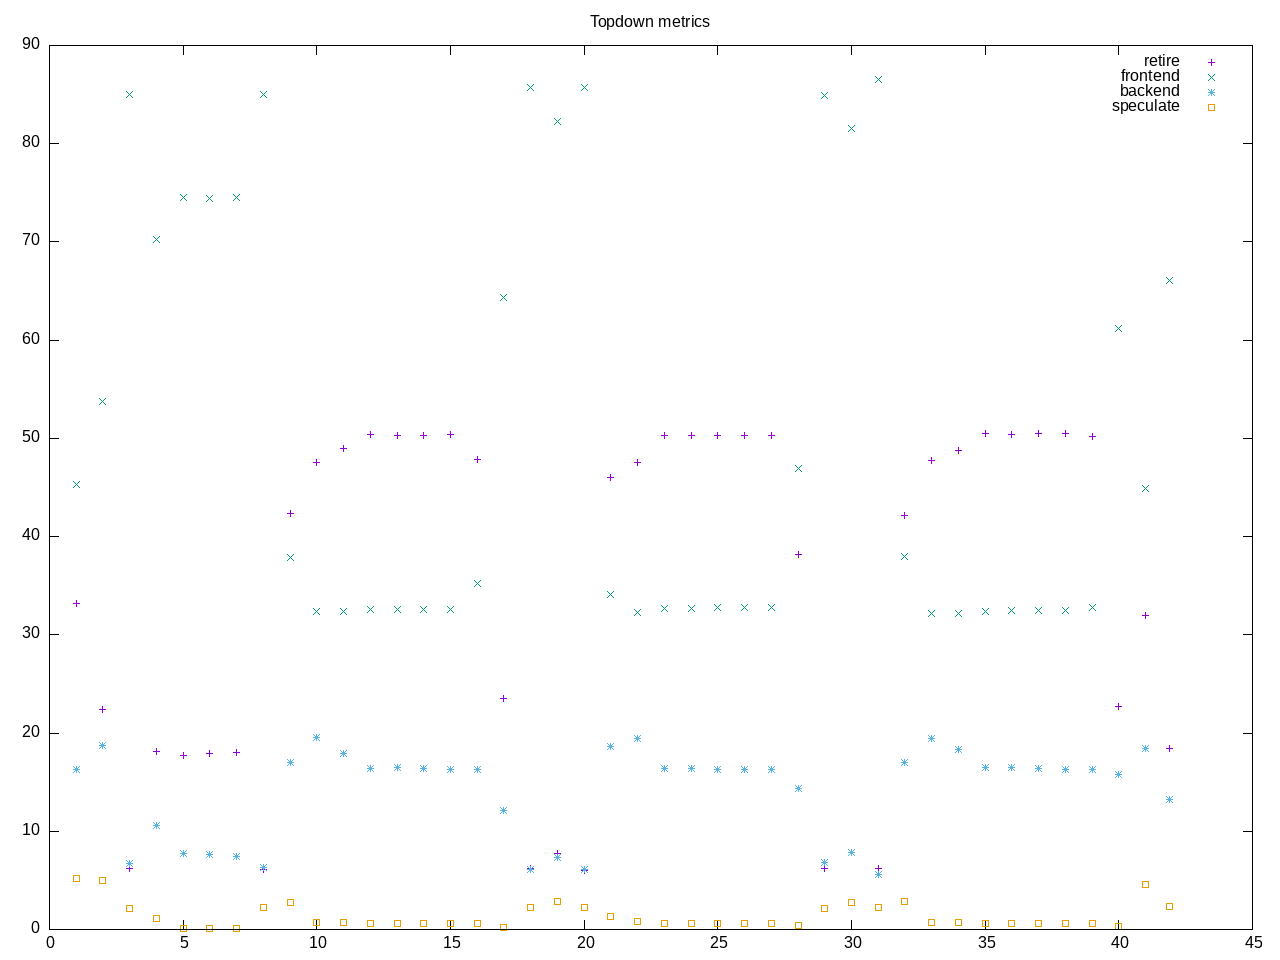
AMD metrics shows this is single-threaded and runs in less than a minute. Backend stalls are low and there is little floating point or L2 access.
elapsed              41.954
on_cpu               0.042          # 0.67 / 16 cores
utime                14.407
stime                13.551
nvcsw                3667           # 86.04%
nivcsw               595            # 13.96%
inblock              0              # 0.00/sec
onblock              16790088       # 400198.95/sec
cpu-clock            27966981919    # 27.967 seconds
task-clock           27971618112    # 27.972 seconds
page faults          165110         # 5902.769/sec
context switches     4280           # 153.012/sec
cpu migrations       319            # 11.404/sec
major page faults    2              # 0.072/sec
minor page faults    165103         # 5902.519/sec
alignment faults     0              # 0.000/sec
emulation faults     0              # 0.000/sec
branches             36500002265    # 128.750 branches per 1000 inst
branch misses        1369450142     # 3.75% branch miss
conditional          30093082710    # 106.150 conditional branches per 1000 inst
indirect             189413110      # 0.668 indirect branches per 1000 inst
cpu-cycles           121264096404   # 0.18 GHz
instructions         280489555903   # 2.31 IPC
slots                246520840950   #
retiring             108081861429   # 43.8% (43.8%)
-- ucode             208269074      #     0.1%
-- fastpath          107873592355   #    43.8%
frontend             97172556531    # 39.4% (39.4%)
-- latency           78129118386    #    31.7%
-- bandwidth         19043438145    #     7.7%
backend              39194677724    # 15.9% (15.9%) low
-- cpu               9679470926     #     3.9%
-- memory            29515206798    #    12.0%
speculation          2034510364     #  0.8% ( 0.8%) low
-- branch mispredict 2009213869     #     0.8%
-- pipeline restart  25296495       #     0.0%
smt-contention       36983215       #  0.0% ( 0.0%)
cpu-cycles           121365883043   # 0.18 GHz
instructions         281240028279   # 2.32 IPC
instructions         94364096212    # 16.955 l2 access per 1000 inst
l2 hit from l1       1517135255     # 5.84% l2 miss
l2 miss from l1      34263921       #
l2 hit from l2 pf    23599948       #
l3 hit from l2 pf    5971599        #
l3 miss from l2 pf   53254420       #
instructions         94178737335    # 2.360 float per 1000 inst
float 512            41             # 0.000 AVX-512 per 1000 inst
float 256            10             # 0.000 AVX-256 per 1000 inst
float 128            222295322      # 2.360 AVX-128 per 1000 inst
float MMX            0              # 0.000 MMX per 1000 inst
float scalar         0              # 0.000 scalar per 1000 inst
instructions         2697638        #
opcache              1003361        # 371.941 opcache per 1000 inst
opcache miss         536407         # 53.5% opcache miss rate
l1 dTLB miss         6475           # 2.400 L1 dTLB per 1000 inst
l2 dTLB miss         1209           # 0.448 L2 dTLB per 1000 inst
instructions         2698623        #
icache               1306796        # 484.245 icache per 1000 inst
icache miss          107669         #  8.2% icache miss rate
l1 iTLB miss         8              # 0.003 L1 iTLB per 1000 inst
l2 iTLB miss         0              # 0.000 L2 iTLB per 1000 inst
tlb flush            19             # 0.007 TLB flush per 1000 inst
Intel metrics
elapsed              39.446
on_cpu               0.040          # 0.65 / 16 cores
utime                18.776
stime                6.749
nvcsw                4047           # 93.68%
nivcsw               273            # 6.32%
inblock              59048          # 1496.92/sec
onblock              16778872       # 425360.42/sec
cpu-clock            25511570118    # 25.512 seconds
task-clock           25515172774    # 25.515 seconds
page faults          152548         # 5978.717/sec
context switches     4331           # 169.742/sec
cpu migrations       344            # 13.482/sec
major page faults    394            # 15.442/sec
minor page faults    152147         # 5963.001/sec
alignment faults     0              # 0.000/sec
emulation faults     0              # 0.000/sec
branches             33410561257    # 121.798 branches per 1000 inst
branch misses        38726732       # 0.12% branch miss
conditional          33410575849    # 121.798 conditional branches per 1000 inst
indirect             194086180      # 0.708 indirect branches per 1000 inst
slots                568310686370   #
retiring             253168976143   # 44.5% (44.5%)
-- ucode             9482689758     #     1.7%
-- fastpath          243686286385   #    42.9%
frontend             68582457368    # 12.1% (12.1%)
-- latency           27346206309    #     4.8%
-- bandwidth         41236251059    #     7.3%
backend              208066438235   # 36.6% (36.6%)
-- cpu               162560138594   #    28.6%
-- memory            45506299641    #     8.0%
speculation          37059301540    #  6.5% ( 6.5%)
-- branch mispredict 5728184679     #     1.0%
-- pipeline restart  31331116861    #     5.5%
smt-contention       0              #  0.0% ( 0.0%)
cpu-cycles           94976267658    # 0.15 GHz
instructions         274031527927   # 2.89 IPC
l2 access            3796563893     # 13.862 l2 access per 1000 inst
l2 miss              588428056      # 15.50% l2 miss
cpu-cycles           94762245616    # 11.8% memory latency
load stalls          9914219291     #  6.0% l1 bound
l1 miss              4275852025     #  2.0% l2 bound
l2 miss              2381220001     #  0.4% l3 bound
l3 miss              1955017893     #  2.1% dram bound
store_stalls         1244352811     #  1.3% store bound
Process overview shows some quick invocations of Java. Test overhead also contributes to the metrics above.
437 processes
	  8 java                    26.96    16.68
	 68 clinfo                  17.52     5.00
	  4 Finalizer               13.48     8.34
	  3 Common-Cleaner          13.47     8.31
	 38 vulkaninfo               1.14     1.31
	  1 dd                       0.16     3.00
	  4 vulkani:disk$0           0.12     0.13
	  6 glxinfo:gdrv0            0.10     0.07
	  6 glxinfo:gl0              0.10     0.07
	  2 llvmpipe-0               0.06     0.07
	  2 llvmpipe-1               0.06     0.07
	  2 llvmpipe-10              0.06     0.07
	  2 llvmpipe-11              0.06     0.07
	  2 llvmpipe-12              0.06     0.07
	  2 llvmpipe-13              0.06     0.07
	  2 llvmpipe-14              0.06     0.07
	  2 llvmpipe-15              0.06     0.07
	  2 llvmpipe-2               0.06     0.07
	  2 llvmpipe-3               0.06     0.07
	  2 llvmpipe-4               0.06     0.07
	  2 llvmpipe-5               0.06     0.07
	  2 llvmpipe-6               0.06     0.07
	  2 llvmpipe-7               0.06     0.07
	  2 llvmpipe-8               0.06     0.07
	  2 llvmpipe-9               0.06     0.07
	  6 php                      0.05     0.08
	  2 glxinfo                  0.05     0.03
	  2 glxinfo:cs0              0.05     0.03
	  2 glxinfo:disk$0           0.05     0.03
	  2 glxinfo:sh0              0.05     0.03
	  2 glxinfo:shlo0            0.05     0.03
	  6 clang                    0.04     0.08
	  1 lspci                    0.01     0.02
	  8 C1 CompilerThre          0.00    16.29
	  4 C2 CompilerThre          0.00    13.48
	  4 G1 Conc#0                0.00    13.48
	  4 G1 Refine#0              0.00    13.48
	  4 GC Thread#0              0.00    13.48
	  4 Reference Handl          0.00    13.48
	  4 Service Thread           0.00    13.48
	  4 Signal Dispatch          0.00    13.48
	  4 Sweeper thread           0.00    13.48
	  4 VM Thread                0.00    13.48
	  5 rm                       0.00     1.19
	  3 rocminfo                 0.00     0.03
	 86 sh                       0.00     0.00
	 12 gcc                      0.00     0.00
	  8 gsettings                0.00     0.00
	  8 stat                     0.00     0.00
	  8 systemd-detect-          0.00     0.00
	  6 llvm-link                0.00     0.00
	  5 gmain                    0.00     0.00
	  5 phoronix-test-s          0.00     0.00
	  4 G1 Main Marker           0.00     0.00
	  4 G1 Young RemSet          0.00     0.00
	  4 VM Periodic Tas          0.00     0.00
	  4 bash                     0.00     0.00
	  3 bork                     0.00     0.00
	  3 bork.sh                  0.00     0.00
	  3 dconf worker             0.00     0.00
	  2 lscpu                    0.00     0.00
	  2 uname                    0.00     0.00
	  2 which                    0.00     0.00
	  2 xset                     0.00     0.00
	  1 cc                       0.00     0.00
	  1 date                     0.00     0.00
	  1 dirname                  0.00     0.00
	  1 dmesg                    0.00     0.00
	  1 dmidecode                0.00     0.00
	  1 grep                     0.00     0.00
	  1 ifconfig                 0.00     0.00
	  1 ip                       0.00     0.00
	  1 lsmod                    0.00     0.00
	  1 mktemp                   0.00     0.00
	  1 ps                       0.00     0.00
	  1 qdbus                    0.00     0.00
	  1 readlink                 0.00     0.00
	  1 realpath                 0.00     0.00
	  1 sed                      0.00     0.00
	  1 sort                     0.00     0.00
	  1 stty                     0.00     0.00
	  1 systemctl                0.00     0.00
	  1 template.sh              0.00     0.00
	  1 wc                       0.00     0.00
	  1 xrandr                   0.00     0.00
0 processes running
47 maximum processes
Computation structure
      720779) bork             cpu=6 start=9.07  finish=16.24
        720780) bork.sh          cpu=15 start=9.07  finish=16.24
          720781) java             cpu=0 start=9.07  finish=16.24
            720782) java             cpu=5 start=9.08  finish=16.24
              720783) GC Thread#0      cpu=-1 start=9.08  finish=16.24
              720784) G1 Main Marker   cpu=0 start=9.08  finish=16.24
              720785) G1 Conc#0        cpu=-1 start=9.08  finish=16.24
              720786) G1 Refine#0      cpu=-1 start=9.09  finish=16.23
              720787) G1 Young RemSet  cpu=0 start=9.09  finish=16.23
              720788) VM Thread        cpu=-1 start=9.09  finish=16.24
              720789) Reference Handl  cpu=-1 start=9.10  finish=16.24
              720790) Finalizer        cpu=3 start=9.10  finish=16.24
              720791) Signal Dispatch  cpu=-1 start=9.10  finish=16.24
              720792) Service Thread   cpu=-1 start=9.10  finish=16.24
              720793) C2 CompilerThre  cpu=-1 start=9.10  finish=16.24
                720796) C1 CompilerThre  cpu=-1 start=9.10  finish=10.64
              720794) C1 CompilerThre  cpu=-1 start=9.10  finish=16.24
              720795) Sweeper thread   cpu=-1 start=9.10  finish=16.24
              720797) VM Periodic Tas  cpu=0 start=9.11  finish=16.23
              720798) Common-Cleaner   cpu=12 start=9.11  finish=16.24