
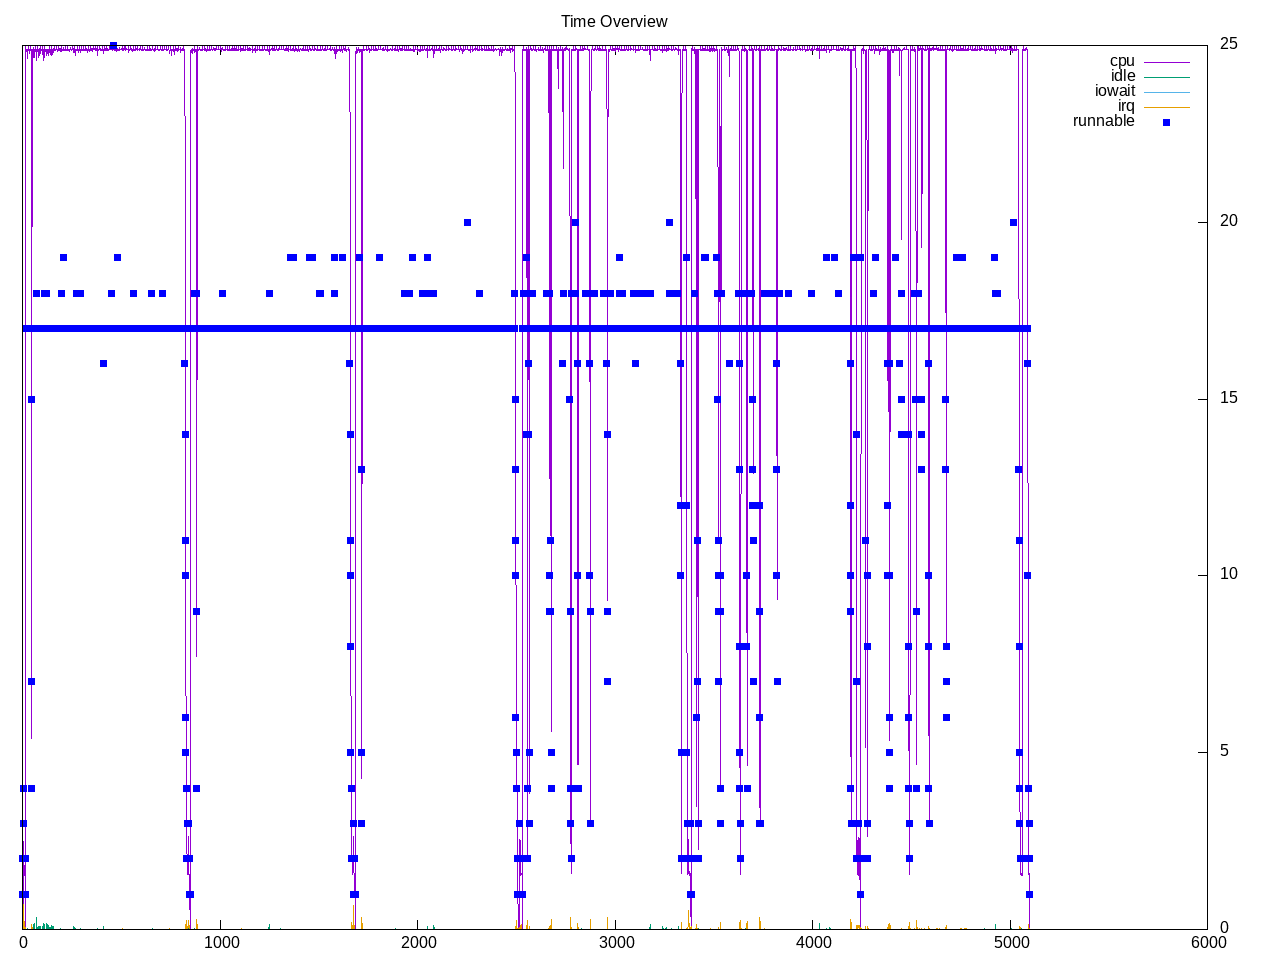
A test of building the llvm compiler stack. The entire stack is built twice, once with Ninja and then with Unix Makefiles. Overall time is slightly faster for Ninja. The overall profile shows except for periods towards end of each build, almost all cores are kept busy.
Overall topdown profile is a workload dominated by frontend stalls with a lower retirement rate. This is similar to other build-* workloads, though backend/memory stalls are slightly higher with LLVM and frontend stalls are slightly lower.
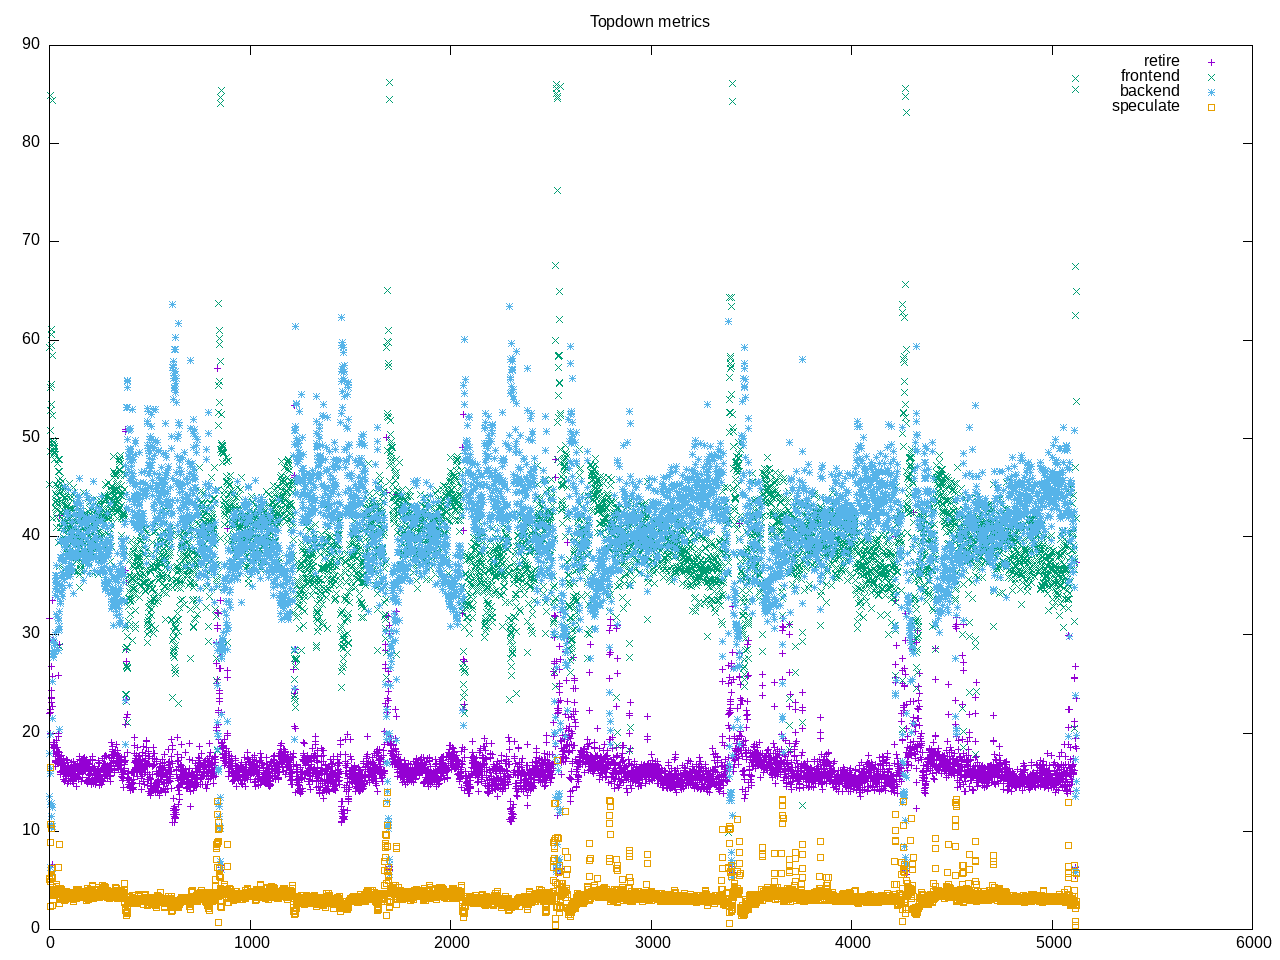
AMD topdown metrics show little floating point, a high amount of branches and a moderate amount of L2 access/miss
elapsed              5163.931
on_cpu               0.945          # 15.11 / 16 cores
utime                72481.356
stime                5561.869
nvcsw                690828         # 26.70%
nivcsw               1896731        # 73.30%
inblock              752            # 0.15/sec
onblock              72693768       # 14077.21/sec
cpu-clock            78056877516054 # 78056.878 seconds
task-clock           78058299825553 # 78058.300 seconds
page faults          1723272985     # 22076.742/sec
context switches     2501754        # 32.050/sec
cpu migrations       84464          # 1.082/sec
major page faults    7702           # 0.099/sec
minor page faults    1723265283     # 22076.644/sec
alignment faults     0              # 0.000/sec
emulation faults     0              # 0.000/sec
branches             53968965816670 # 209.027 branches per 1000 inst
branch misses        1624267586008  # 3.01% branch miss
conditional          41377495312890 # 160.259 conditional branches per 1000 inst
indirect             1239736919294  # 4.802 indirect branches per 1000 inst
cpu-cycles           318616249965597 # 3.88 GHz
instructions         257239532203885 # 0.81 IPC
slots                638462591892552 #
retiring             83608634229281 # 13.1% (16.4%)
-- ucode             98629507536    #     0.0%
-- fastpath          83510004721745 #    13.1%
frontend             200104012133847 # 31.3% (39.2%)
-- latency           150156168729132 #    23.5%
-- bandwidth         49947843404715 #     7.8%
backend              209812204890246 # 32.9% (41.1%)
-- cpu               17481000115336 #     2.7%
-- memory            192331204774910 #    30.1%
speculation          16989232947648 #  2.7% ( 3.3%)
-- branch mispredict 16820144024682 #     2.6%
-- pipeline restart  169088922966   #     0.0%
smt-contention       127947932556371 # 20.0% ( 0.0%)
cpu-cycles           318995838054107 # 3.88 GHz
instructions         257262438648603 # 0.81 IPC
instructions         85844563756236 # 57.868 l2 access per 1000 inst
l2 hit from l1       4340327891636  # 21.96% l2 miss
l2 miss from l1      756553839542   #
l2 hit from l2 pf    293116256893   #
l3 hit from l2 pf    124042424042   #
l3 miss from l2 pf   210191796922   #
instructions         85821948979048 # 18.776 float per 1000 inst
float 512            38882          # 0.000 AVX-512 per 1000 inst
float 256            18532849       # 0.000 AVX-256 per 1000 inst
float 128            1611376882605  # 18.776 AVX-128 per 1000 inst
float MMX            0              # 0.000 MMX per 1000 inst
float scalar         5              # 0.000 scalar per 1000 inst
Intel metrics. Perhaps counted slightly differently but this workload as others shows higher IPC, lower GHz and then higher retirement rate than AMD.
elapsed              6082.871
on_cpu               0.952          # 15.23 / 16 cores
utime                87827.392
stime                4786.786
nvcsw                920851         # 30.45%
nivcsw               2103588        # 69.55%
inblock              423848         # 69.68/sec
onblock              72678008       # 11947.98/sec
cpu-clock            92626124571056 # 92626.125 seconds
task-clock           92627957812326 # 92627.958 seconds
page faults          1715040925     # 18515.370/sec
context switches     2950846        # 31.857/sec
cpu migrations       96215          # 1.039/sec
major page faults    2083           # 0.022/sec
minor page faults    1715038842     # 18515.348/sec
alignment faults     0              # 0.000/sec
emulation faults     0              # 0.000/sec
branches             53412577346061 # 207.493 branches per 1000 inst
branch misses        1337965435641  # 2.50% branch miss
conditional          53412581027341 # 207.493 conditional branches per 1000 inst
indirect             10008132965242 # 38.879 indirect branches per 1000 inst
slots                437772678130796 #
retiring             133128924746572 # 30.4% (30.4%)
-- ucode             10347229360575 #     2.4%
-- fastpath          122781695385997 #    28.0%
frontend             154233918698731 # 35.2% (35.2%)
-- latency           89782197058371 #    20.5%
-- bandwidth         64451721640360 #    14.7%
backend              97914185694265 # 22.4% (22.4%)
-- cpu               24835061651941 #     5.7%
-- memory            73079124042324 #    16.7%
speculation          53004289903871 # 12.1% (12.1%)
-- branch mispredict 51316773822425 #    11.7%
-- pipeline restart  1687516081446  #     0.4%
smt-contention       0              #  0.0% ( 0.0%)
cpu-cycles           194627005685821 # 2.00 GHz
instructions         194392697442484 # 1.00 IPC
l2 access            8477188822805  # 59.773 l2 access per 1000 inst
l2 miss              2579404345601  # 30.43% l2 miss
Process summary is incomplete. Ninja completes, Unix makefiles dies part way through, but at least half is sufficient to get a good profile. Overall cpu time is dominated by the C++ front end, with a lesser amount in tblgen program. Many invocations of the assembler with almost no time.
78068 processes
	12328 cc1plus              48003.58  2933.97
	1342 llvm-tblgen           2043.24   144.27
	901 ld                     423.71   113.10
	12793 as                      84.78     7.24
	548 cc1                     14.60     1.46
	  5 xz                      12.57     0.90
	 34 clinfo                   9.59     3.66
	7885 cmake                    9.49    10.41
	1443 ninja                    3.77     2.85
	 19 vulkaninfo               0.73     0.73
	850 ranlib                   0.69     5.26
	1573 gmake                    0.60     0.61
	849 ar                       0.59     5.16
	 10 tar                      0.54     9.47
	 80 python3.10               0.50     0.04
	 13 rm                       0.09     6.98
	  2 vulkani:disk$0           0.07     0.07
	  3 glxinfo:gdrv0            0.07     0.04
	  6 clang                    0.06     0.06
	  1 llvmpipe-0               0.04     0.04
	  1 llvmpipe-1               0.04     0.04
	  1 llvmpipe-10              0.04     0.04
	  1 llvmpipe-11              0.04     0.04
	  1 llvmpipe-12              0.04     0.04
	  1 llvmpipe-13              0.04     0.04
	  1 llvmpipe-14              0.04     0.04
	  1 llvmpipe-15              0.04     0.04
	  1 llvmpipe-2               0.04     0.04
	  1 llvmpipe-3               0.04     0.04
	  1 llvmpipe-4               0.04     0.04
	  1 llvmpipe-5               0.04     0.04
	  1 llvmpipe-6               0.04     0.04
	  1 llvmpipe-7               0.04     0.04
	  1 llvmpipe-8               0.04     0.04
	  1 llvmpipe-9               0.04     0.04
	  5 py3versions              0.04     0.01
	  1 glxinfo                  0.03     0.02
	  1 glxinfo:cs0              0.03     0.02
	  1 glxinfo:disk$0           0.03     0.02
	  1 glxinfo:sh0              0.03     0.02
	  1 glxinfo:shlo0            0.03     0.02
	  1 ps                       0.00     0.01
	22348 sh                       0.00     0.00
	12872 c++                      0.00     0.00
	949 cc                       0.00     0.00
	901 collect2                 0.00     0.00
	 30 uname                    0.00     0.00
	 25 git                      0.00     0.00
	 20 pkg-config               0.00     0.00
	 13 gcc                      0.00     0.00
	 10 gsettings                0.00     0.00
	  8 systemd-detect-          0.00     0.00
	  7 stat                     0.00     0.00
	  6 bash                     0.00     0.00
	  6 llvm-link                0.00     0.00
	  6 sed                      0.00     0.00
	  5 mkdir                    0.00     0.00
	  5 mv                       0.00     0.00
	  4 build-llvm               0.00     0.00
	  4 phoronix-test-s          0.00     0.00
	  3 gmain                    0.00     0.00
	  2 dconf worker             0.00     0.00
	  2 which                    0.00     0.00
	  1 date                     0.00     0.00
	  1 dirname                  0.00     0.00
	  1 grep                     0.00     0.00
	  1 ifconfig                 0.00     0.00
	  1 ip                       0.00     0.00
	  1 lscpu                    0.00     0.00
	  1 mktemp                   0.00     0.00
	  1 python                   0.00     0.00
	  1 python3                  0.00     0.00
	  1 qdbus                    0.00     0.00
	  1 readlink                 0.00     0.00
	  1 realpath                 0.00     0.00
	  1 sort                     0.00     0.00
	  1 stty                     0.00     0.00
	  1 systemctl                0.00     0.00
	  1 template.sh              0.00     0.00
	  1 wc                       0.00     0.00
	  1 xrandr                   0.00     0.00
	  1 xset                     0.00     0.00
83 processes running
99 maximum processes
The following pattern is used for compilation
            58628) ninja            cpu=3 start=9.98  finish=9.98
            58629) ninja            cpu=5 start=9.99  finish=9.99
            58630) ninja            cpu=11 start=9.99  finish=9.99
            58631) ninja            cpu=4 start=9.99  finish=10.03
              58632) sh               cpu=15 start=10.00 finish=10.01
                58633) cc               cpu=0 start=10.00 finish=10.01
                  58634) cc1              cpu=1 start=10.00 finish=10.01
                  58635) as               cpu=14 start=10.01 finish=10.01
              58636) sh               cpu=5 start=10.01 finish=10.03
                58637) cc               cpu=14 start=10.02 finish=10.03
                  58638) collect2         cpu=0 start=10.02 finish=10.03
                    58639) ld               cpu=15 start=10.02 finish=10.03