
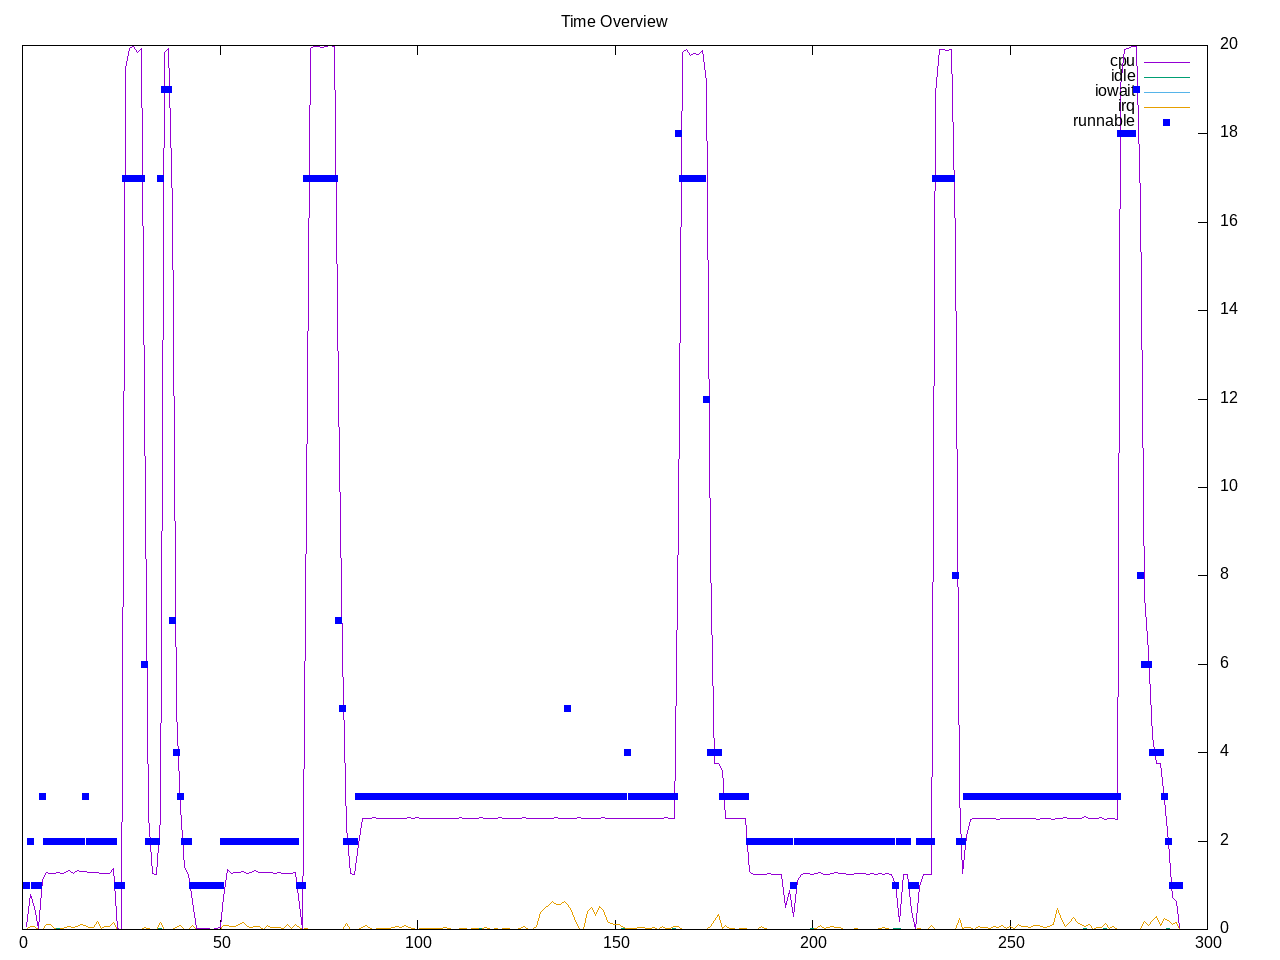
This workload builds the python reference implementation. There are two builds – a quick default build followed by a longer running release build with PGO and LTO that takes much longer. These builds appear to have just a few processes much of the time.
Topdown profile shows a mismash with a small section that is backend bound, a lot of frontend bound but also still a moderate retirement rate.
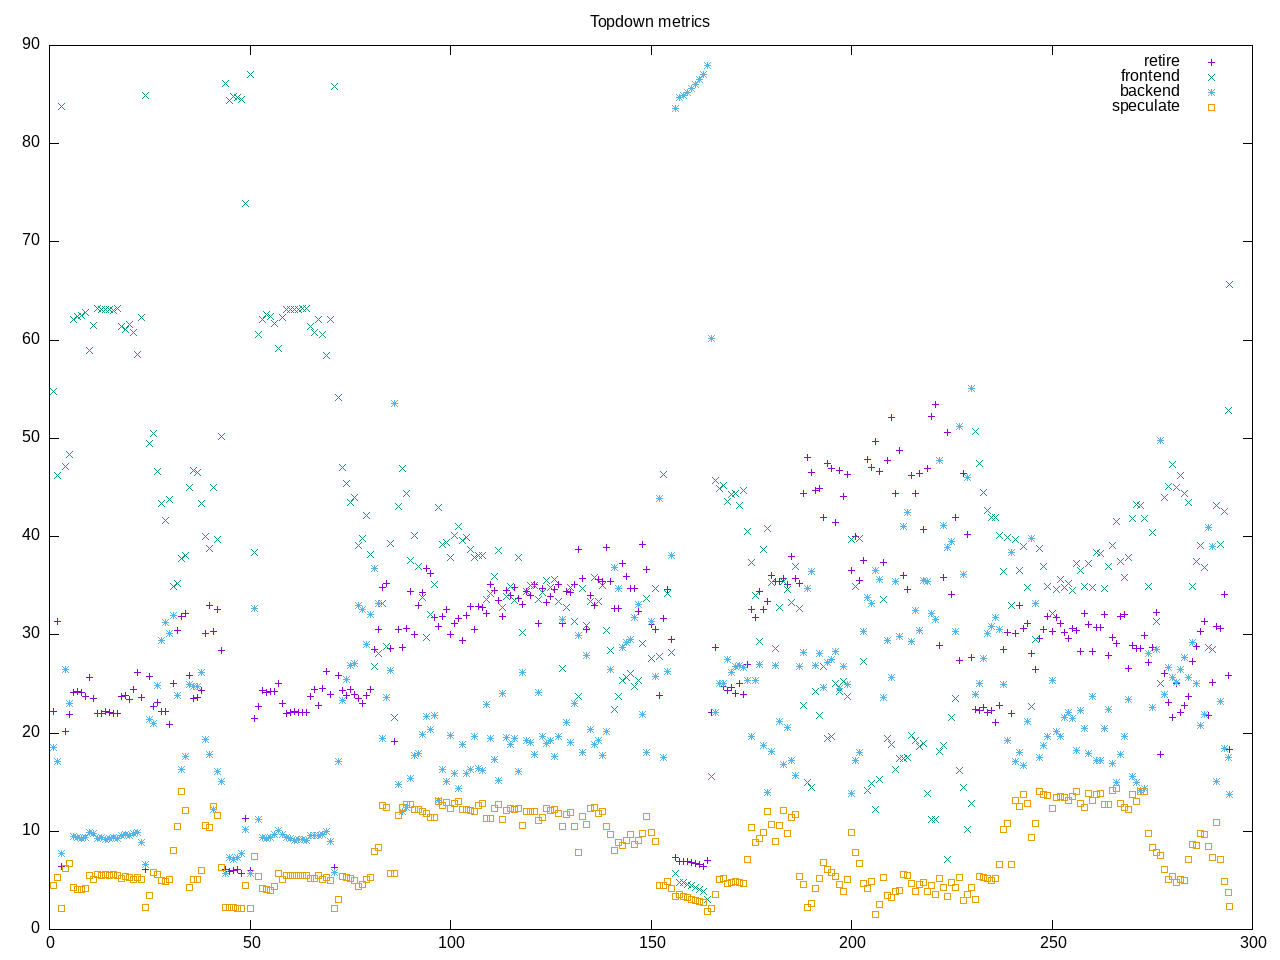
AMD metrics are a composite of the chart above. Frontend bound stalls dominate. 1/5 of the instructions are branches and there is little floating point.
elapsed              294.674
on_cpu               0.206          # 3.29 / 16 cores
utime                893.905
stime                76.692
nvcsw                67142          # 42.74%
nivcsw               89970          # 57.26%
inblock              0              # 0.00/sec
onblock              6307048        # 21403.46/sec
cpu-clock            969640099315   # 969.640 seconds
task-clock           969714791934   # 969.715 seconds
page faults          20445840       # 21084.385/sec
context switches     137572         # 141.869/sec
cpu migrations       3852           # 3.972/sec
major page faults    70             # 0.072/sec
minor page faults    20445770       # 21084.313/sec
alignment faults     0              # 0.000/sec
emulation faults     0              # 0.000/sec
branches             1263933056973  # 209.294 branches per 1000 inst
branch misses        34718136087    # 2.75% branch miss
conditional          978456026819   # 162.022 conditional branches per 1000 inst
indirect             28886374282    # 4.783 indirect branches per 1000 inst
cpu-cycles           3927940269465  # 0.83 GHz
instructions         5937421788873  # 1.51 IPC
slots                8063145430038  #
retiring             1967167817888  # 24.4% (27.2%)
-- ucode             2070157350     #     0.0%
-- fastpath          1965097660538  #    24.4%
frontend             2824239940812  # 35.0% (39.0%)
-- latency           2017706742918  #    25.0%
-- bandwidth         806533197894   #    10.0%
backend              1919470574265  # 23.8% (26.5%)
-- cpu               258477109913   #     3.2%
-- memory            1660993464352  #    20.6%
speculation          529853804360   #  6.6% ( 7.3%)
-- branch mispredict 522073957926   #     6.5%
-- pipeline restart  7779846434     #     0.1%
smt-contention       822390673299   # 10.2% ( 0.0%)
cpu-cycles           3938096924311  # 0.83 GHz
instructions         5938426219684  # 1.51 IPC
instructions         2010234670211  # 37.745 l2 access per 1000 inst
l2 hit from l1       64750413013    # 19.12% l2 miss
l2 miss from l1      8916585026     #
l2 hit from l2 pf    5535757794     #
l3 hit from l2 pf    3443656207     #
l3 miss from l2 pf   2146741781     #
instructions         2009987788704  # 20.783 float per 1000 inst
float 512            5524           # 0.000 AVX-512 per 1000 inst
float 256            39346          # 0.000 AVX-256 per 1000 inst
float 128            41773787580    # 20.783 AVX-128 per 1000 inst
float MMX            0              # 0.000 MMX per 1000 inst
float scalar         97743          # 0.000 scalar per 1000 inst
instructions         2706172        #
opcache              1010366        # 373.356 opcache per 1000 inst
opcache miss         541242         # 53.6% opcache miss rate
l1 dTLB miss         5369           # 1.984 L1 dTLB per 1000 inst
l2 dTLB miss         1181           # 0.436 L2 dTLB per 1000 inst
instructions         2689543        #
icache               1313506        # 488.375 icache per 1000 inst
icache miss          109997         #  8.4% icache miss rate
l1 iTLB miss         9              # 0.003 L1 iTLB per 1000 inst
l2 iTLB miss         0              # 0.000 L2 iTLB per 1000 inst
tlb flush            20             # 0.007 TLB flush per 1000 inst
Intel metrics
elapsed              324.771
on_cpu               0.203          # 3.25 / 16 cores
utime                1005.209
stime                49.719
nvcsw                68644          # 43.09%
nivcsw               90647          # 56.91%
inblock              105168         # 323.82/sec
onblock              6299984        # 19398.21/sec
cpu-clock            1052934916576  # 1052.935 seconds
task-clock           1053092218263  # 1053.092 seconds
page faults          20459766       # 19428.276/sec
context switches     140082         # 133.020/sec
cpu migrations       5057           # 4.802/sec
major page faults    415            # 0.394/sec
minor page faults    20459351       # 19427.882/sec
alignment faults     0              # 0.000/sec
emulation faults     0              # 0.000/sec
branches             1252397412602  # 207.980 branches per 1000 inst
branch misses        30147723172    # 2.41% branch miss
conditional          1252398109242  # 207.980 conditional branches per 1000 inst
indirect             123489984664   # 20.507 indirect branches per 1000 inst
slots                13345151418776 #
retiring             4518175248187  # 33.9% (33.9%)
-- ucode             338293584704   #     2.5%
-- fastpath          4179881663483  #    31.3%
frontend             4419550588938  # 33.1% (33.1%)
-- latency           2249693527456  #    16.9%
-- bandwidth         2169857061482  #    16.3%
backend              1978497388105  # 14.8% (14.8%) low
-- cpu               879770968330   #     6.6%
-- memory            1098726419775  #     8.2%
speculation          2486337364015  # 18.6% (18.6%) high
-- branch mispredict 2411739973223  #    18.1%
-- pipeline restart  74597390792    #     0.6%
smt-contention       0              #  0.0% ( 0.0%)
cpu-cycles           3207783156104  # 0.62 GHz
instructions         5611188459036  # 1.75 IPC
l2 access            173010524412   # 35.971 l2 access per 1000 inst
l2 miss              45961720723    # 26.57% l2 miss
cpu-cycles           2745334048792  # 23.3% memory latency
load stalls          618825196463   #  3.4% l1 bound
l1 miss              525797505055   # 10.3% l2 bound
l2 miss              243721523743   #  2.5% l3 bound
l3 miss              175148141314   #  6.4% dram bound
store_stalls         19524283725    #  0.7% store bound
Process overview shows the largest portion of time spent in python with other processes mixed
21759 processes
	213 python                1725.33    47.47
	1960 cc1                    458.14    25.39
	151 lto1                   298.61     6.30
	1816 as                      59.87     5.13
	 68 clinfo                  16.42     5.98
	799 ld                       3.61     1.32
	 56 _testembed               2.27     0.15
	 38 vulkaninfo               1.14     1.14
	  2 gzip                     0.92     0.03
	5053 bash                     0.67     2.50
	  4 vulkani:disk$0           0.12     0.12
	  6 php                      0.11     0.16
	 14 make                     0.10     0.07
	  6 glxinfo:gdrv0            0.10     0.05
	  6 glxinfo:gl0              0.10     0.05
	  2 llvmpipe-0               0.06     0.06
	  2 llvmpipe-1               0.06     0.06
	  2 llvmpipe-10              0.06     0.06
	  2 llvmpipe-11              0.06     0.06
	  2 llvmpipe-12              0.06     0.06
	  2 llvmpipe-13              0.06     0.06
	  2 llvmpipe-14              0.06     0.06
	  2 llvmpipe-15              0.06     0.06
	  2 llvmpipe-2               0.06     0.06
	  2 llvmpipe-3               0.06     0.06
	  2 llvmpipe-4               0.06     0.06
	  2 llvmpipe-5               0.06     0.06
	  2 llvmpipe-6               0.06     0.06
	  2 llvmpipe-7               0.06     0.06
	  2 llvmpipe-8               0.06     0.06
	  2 llvmpipe-9               0.06     0.06
	  2 glxinfo                  0.06     0.03
	  2 glxinfo:cs0              0.06     0.03
	  2 glxinfo:disk$0           0.06     0.03
	  2 glxinfo:sh0              0.06     0.03
	  2 glxinfo:shlo0            0.06     0.03
	  6 clang                    0.05     0.07
	  2 tar                      0.04     0.46
	  3 rocminfo                 0.03     0.00
	  6 print                    0.02     0.00
	  3 ar                       0.01     0.42
	 12 pkg-config               0.01     0.00
	3222 rm                       0.00     0.25
	151 lto-wrapper              0.00     0.13
	2362 gcc                      0.00     0.07
	 46 find                     0.00     0.06
	  1 lspci                    0.00     0.03
	2141 cat                      0.00     0.00
	1465 sed                      0.00     0.00
	797 collect2                 0.00     0.00
	353 grep                     0.00     0.00
	258 mv                       0.00     0.00
	223 sh                       0.00     0.00
	 84 conftest                 0.00     0.00
	 68 basename                 0.00     0.00
	 32 configure                0.00     0.00
	 32 uname                    0.00     0.00
	 21 bunzip2                  0.00     0.00
	 19 dirname                  0.00     0.00
	 18 expr                     0.00     0.00
	 15 ldd                      0.00     0.00
	 14 awk                      0.00     0.00
	 14 mkdir                    0.00     0.00
	 12 gsettings                0.00     0.00
	 12 tr                       0.00     0.00
	  9 ld-linux-x86-64          0.00     0.00
	  8 cc                       0.00     0.00
	  8 ln                       0.00     0.00
	  8 stat                     0.00     0.00
	  8 systemd-detect-          0.00     0.00
	  7 sort                     0.00     0.00
	  6 hostname                 0.00     0.00
	  6 ld-linux.so.2            0.00     0.00
	  6 llvm-link                0.00     0.00
	  6 rmdir                    0.00     0.00
	  5 mktemp                   0.00     0.00
	  5 phoronix-test-s          0.00     0.00
	  4 arch                     0.00     0.00
	  4 chmod                    0.00     0.00
	  4 diff                     0.00     0.00
	  4 install                  0.00     0.00
	  4 ls                       0.00     0.00
	  3 gmain                    0.00     0.00
	  3 touch                    0.00     0.00
	  2 build-python             0.00     0.00
	  2 lscpu                    0.00     0.00
	  2 which                    0.00     0.00
	  2 xset                     0.00     0.00
	  1 date                     0.00     0.00
	  1 dconf worker             0.00     0.00
	  1 dmesg                    0.00     0.00
	  1 dmidecode                0.00     0.00
	  1 ifconfig                 0.00     0.00
	  1 ip                       0.00     0.00
	  1 lsmod                    0.00     0.00
	  1 ps                       0.00     0.00
	  1 qdbus                    0.00     0.00
	  1 readlink                 0.00     0.00
	  1 realpath                 0.00     0.00
	  1 stty                     0.00     0.00
	  1 systemctl                0.00     0.00
	  1 template.sh              0.00     0.00
	  1 true                     0.00     0.00
	  1 wc                       0.00     0.00
	  1 xrandr                   0.00     0.00
0 processes running
109 maximum processes