
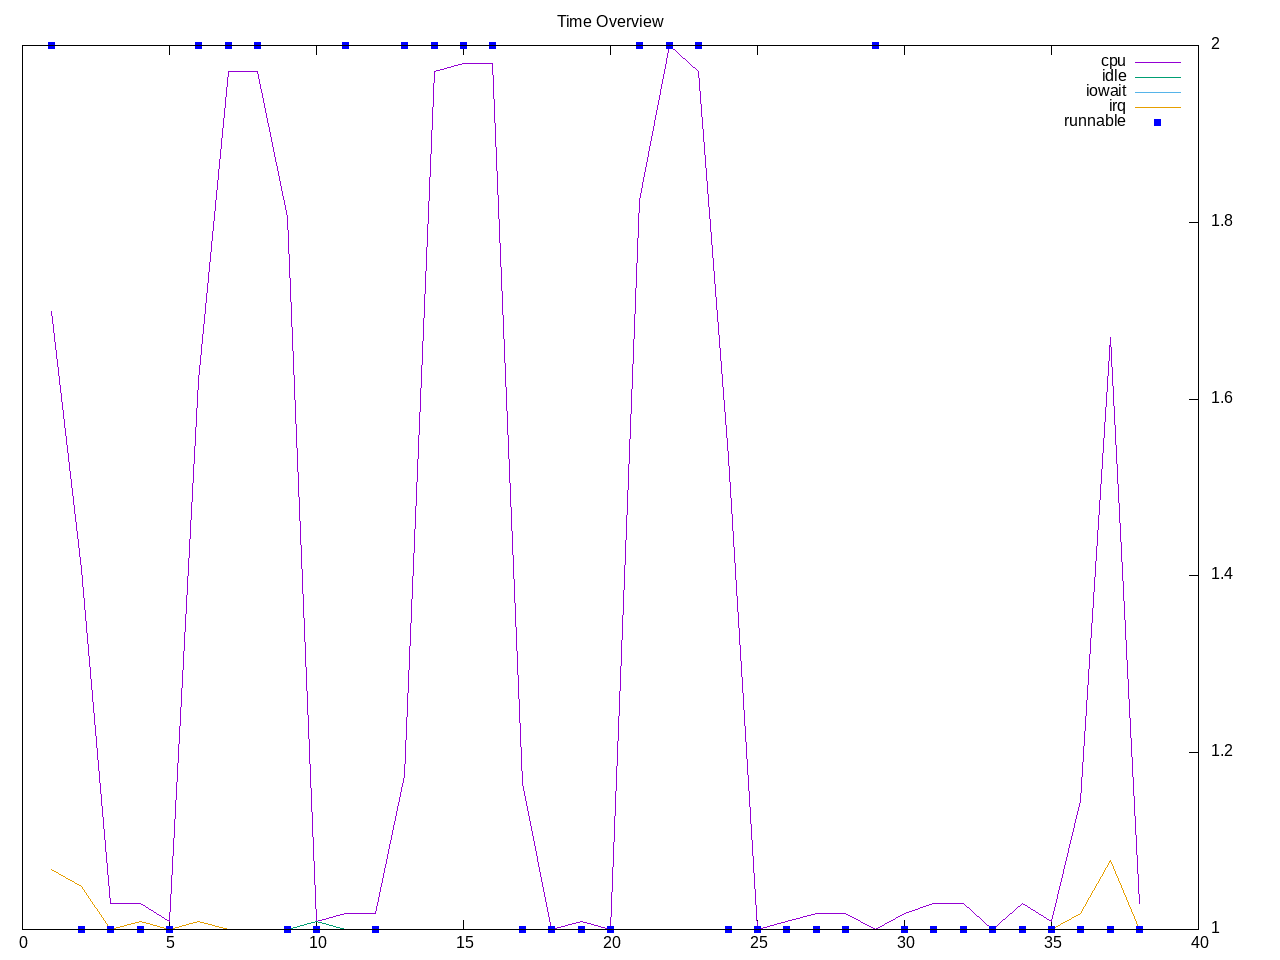
Bullet is a physics engine. There are 7 quick running tests and all iterations are done within a minute.
Topdown profile is similarly sparse
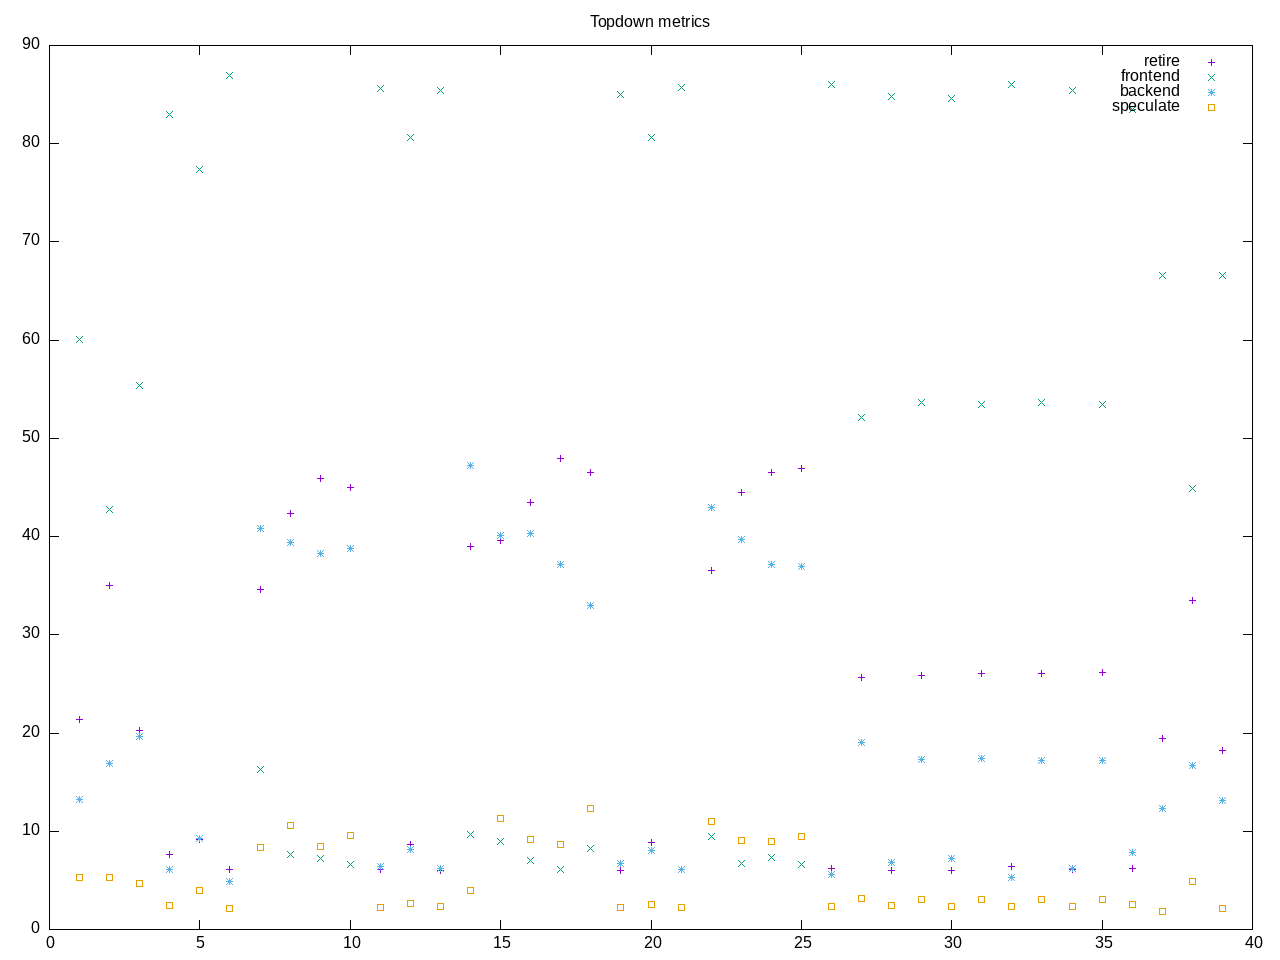
AMD metrics show a moderate retirement rate with a mix of cpu and memory backend stalls.
elapsed              38.253
on_cpu               0.019          # 0.31 / 16 cores
utime                11.022
stime                0.892
nvcsw                2056           # 88.05%
nivcsw               279            # 11.95%
inblock              0              # 0.00/sec
onblock              18296          # 478.29/sec
cpu-clock            11932280613    # 11.932 seconds
task-clock           11934907928    # 11.935 seconds
page faults          196140         # 16434.144/sec
context switches     2356           # 197.404/sec
cpu migrations       257            # 21.533/sec
major page faults    4              # 0.335/sec
minor page faults    196136         # 16433.809/sec
alignment faults     0              # 0.000/sec
emulation faults     0              # 0.000/sec
branches             12216335844    # 101.404 branches per 1000 inst
branch misses        245967672      # 2.01% branch miss
conditional          9473338786     # 78.635 conditional branches per 1000 inst
indirect             261183127      # 2.168 indirect branches per 1000 inst
cpu-cycles           47224082943    # 0.08 GHz
instructions         118935289431   # 2.52 IPC
slots                96619580664    #
retiring             40988917158    # 42.4% (42.4%)
-- ucode             43012882       #     0.0%
-- fastpath          40945904276    #    42.4%
frontend             11607690657    # 12.0% (12.0%)
-- latency           8104026678     #     8.4%
-- bandwidth         3503663979     #     3.6%
backend              35333296489    # 36.6% (36.6%)
-- cpu               19455206170    #    20.1%
-- memory            15878090319    #    16.4%
speculation          8652869371     #  9.0% ( 9.0%)
-- branch mispredict 8254776210     #     8.5%
-- pipeline restart  398093161      #     0.4%
smt-contention       36537351       #  0.0% ( 0.0%)
cpu-cycles           4256144502     # 0.08 GHz
instructions         7760686750     # 1.82 IPC
instructions         3022290915     # 32.048 l2 access per 1000 inst
l2 hit from l1       81461827       # 18.72% l2 miss
l2 miss from l1      9759834        #
l2 hit from l2 pf    7023058        #
l3 hit from l2 pf    3534820        #
l3 miss from l2 pf   4838165        #
instructions         2885024594     # 11.427 float per 1000 inst
float 512            28             # 0.000 AVX-512 per 1000 inst
float 256            0              # 0.000 AVX-256 per 1000 inst
float 128            32966086       # 11.427 AVX-128 per 1000 inst
float MMX            0              # 0.000 MMX per 1000 inst
float scalar         0              # 0.000 scalar per 1000 inst
instructions         2677081        #
opcache              990295         # 369.916 opcache per 1000 inst
opcache miss         531498         # 53.7% opcache miss rate
l1 dTLB miss         6356           # 2.374 L1 dTLB per 1000 inst
l2 dTLB miss         1184           # 0.442 L2 dTLB per 1000 inst
instructions         2704559        #
icache               1317544        # 487.157 icache per 1000 inst
icache miss          110111         #  8.4% icache miss rate
l1 iTLB miss         13             # 0.005 L1 iTLB per 1000 inst
l2 iTLB miss         0              # 0.000 L2 iTLB per 1000 inst
tlb flush            19             # 0.007 TLB flush per 1000 inst
Intel metrics
elapsed              38.068
on_cpu               0.020          # 0.32 / 16 cores
utime                11.744
stime                0.551
nvcsw                1917           # 92.21%
nivcsw               162            # 7.79%
inblock              5200           # 136.60/sec
onblock              7040           # 184.93/sec
cpu-clock            12304472437    # 12.304 seconds
task-clock           12307116018    # 12.307 seconds
page faults          185388         # 15063.480/sec
context switches     2096           # 170.308/sec
cpu migrations       263            # 21.370/sec
major page faults    25             # 2.031/sec
minor page faults    185363         # 15061.449/sec
alignment faults     0              # 0.000/sec
emulation faults     0              # 0.000/sec
branches             11900554365    # 99.862 branches per 1000 inst
branch misses        205043401      # 1.72% branch miss
conditional          11900566301    # 99.862 conditional branches per 1000 inst
indirect             262367471      # 2.202 indirect branches per 1000 inst
slots                20090830988    #
retiring             7357919108     # 36.6% (36.6%)
-- ucode             641108235      #     3.2%
-- fastpath          6716810873     #    33.4%
frontend             5689322420     # 28.3% (28.3%)
-- latency           2717104724     #    13.5%
-- bandwidth         2972217696     #    14.8%
backend              4791155373     # 23.8% (23.8%)
-- cpu               1940270154     #     9.7%
-- memory            2850885219     #    14.2%
speculation          2296151869     # 11.4% (11.4%) high
-- branch mispredict 2113612426     #    10.5%
-- pipeline restart  182539443      #     0.9%
smt-contention       0              #  0.0% ( 0.0%)
cpu-cycles           45669561675    # 0.08 GHz
instructions         119196912953   # 2.61 IPC
l2 access            3608690017     # 30.316 l2 access per 1000 inst
l2 miss              1216320423     # 33.71% l2 miss
cpu-cycles           3363730928     # 21.5% memory latency
load stalls          652478258      #  0.9% l1 bound
l1 miss              621093255      #  9.0% l2 bound
l2 miss              317046637      #  2.4% l3 bound
l3 miss              237542561      #  7.1% dram bound
store_stalls         70449159       #  2.1% store bound
Process overview shows mostly the test harness
299 processes
	 68 clinfo                  20.50     5.66
	 38 vulkaninfo               1.13     1.14
	  6 glxinfo:gdrv0            0.18     0.03
	  6 glxinfo:gl0              0.18     0.03
	  4 vulkani:disk$0           0.12     0.12
	  2 glxinfo                  0.08     0.01
	  2 glxinfo:cs0              0.08     0.01
	  2 glxinfo:disk$0           0.08     0.01
	  2 glxinfo:sh0              0.08     0.01
	  2 glxinfo:shlo0            0.08     0.01
	  2 llvmpipe-0               0.06     0.06
	  2 llvmpipe-1               0.06     0.06
	  2 llvmpipe-10              0.06     0.06
	  2 llvmpipe-11              0.06     0.06
	  2 llvmpipe-12              0.06     0.06
	  2 llvmpipe-13              0.06     0.06
	  2 llvmpipe-14              0.06     0.06
	  2 llvmpipe-15              0.06     0.06
	  2 llvmpipe-2               0.06     0.06
	  2 llvmpipe-3               0.06     0.06
	  2 llvmpipe-4               0.06     0.06
	  2 llvmpipe-5               0.06     0.06
	  2 llvmpipe-6               0.06     0.06
	  2 llvmpipe-7               0.06     0.06
	  2 llvmpipe-8               0.06     0.06
	  2 llvmpipe-9               0.06     0.06
	  6 php                      0.05     0.05
	  3 rocminfo                 0.03     0.00
	  3 clang                    0.02     0.04
	  1 lspci                    0.01     0.01
	 57 sh                       0.00     0.00
	 11 gsettings                0.00     0.00
	  6 gcc                      0.00     0.00
	  5 phoronix-test-s          0.00     0.00
	  5 stat                     0.00     0.00
	  4 gmain                    0.00     0.00
	  4 systemd-detect-          0.00     0.00
	  3 llvm-link                0.00     0.00
	  2 lscpu                    0.00     0.00
	  2 uname                    0.00     0.00
	  2 which                    0.00     0.00
	  2 xset                     0.00     0.00
	  1 cc                       0.00     0.00
	  1 date                     0.00     0.00
	  1 dconf worker             0.00     0.00
	  1 dirname                  0.00     0.00
	  1 dmesg                    0.00     0.00
	  1 dmidecode                0.00     0.00
	  1 grep                     0.00     0.00
	  1 ifconfig                 0.00     0.00
	  1 ip                       0.00     0.00
	  1 lsmod                    0.00     0.00
	  1 mktemp                   0.00     0.00
	  1 qdbus                    0.00     0.00
	  1 readlink                 0.00     0.00
	  1 realpath                 0.00     0.00
	  1 sed                      0.00     0.00
	  1 sort                     0.00     0.00
	  1 template.sh              0.00     0.00
	  1 wc                       0.00     0.00
	  1 xrandr                   0.00     0.00
0 processes running
47 maximum processes