
Livermore OpenMP test with one workload test. Looks to be mostly single-threaded with short sections of multi-threaded runs.
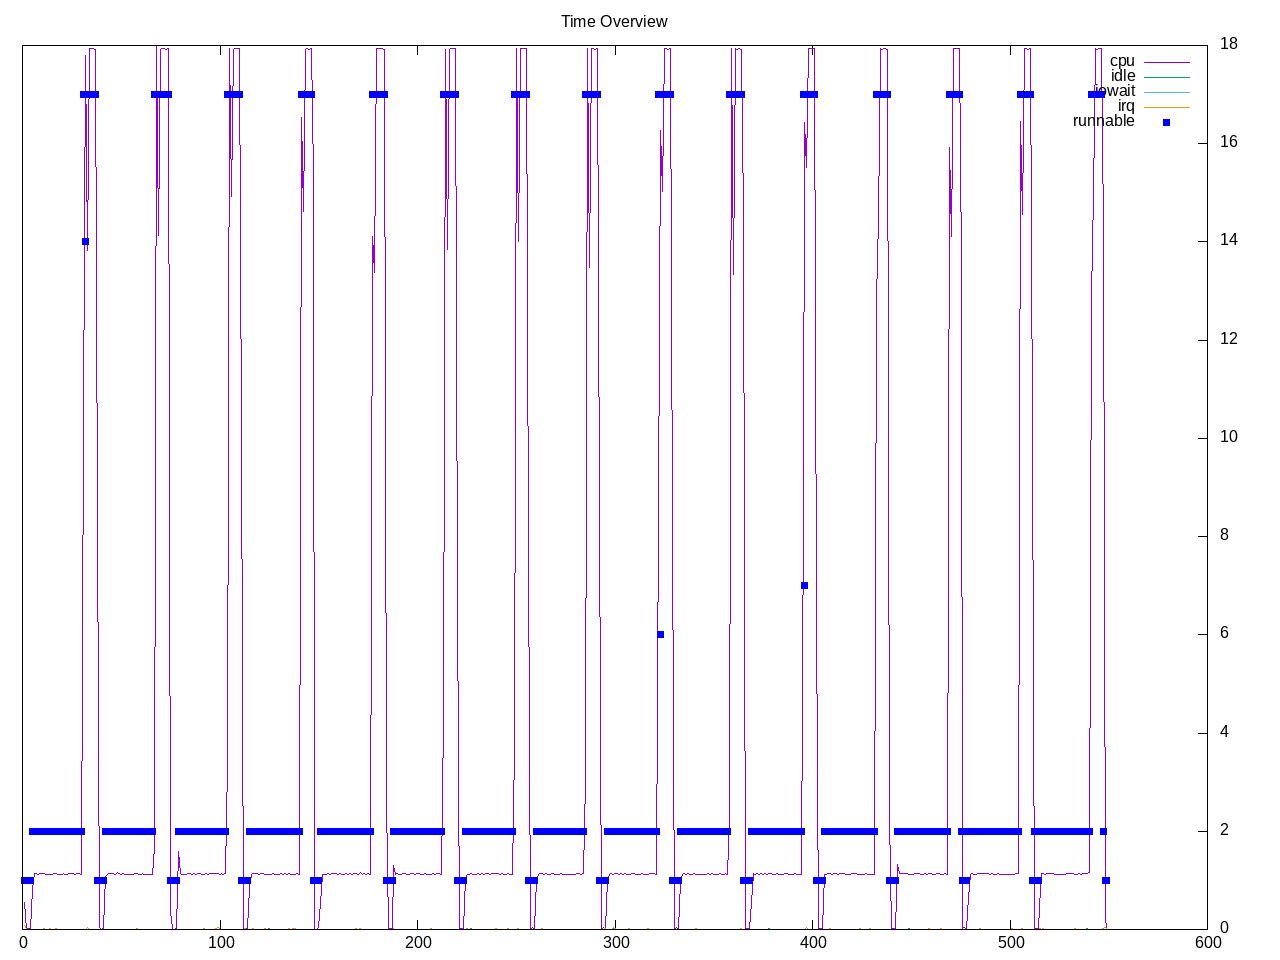
Topdown profile looks backend bound with the short parallel sections less so.
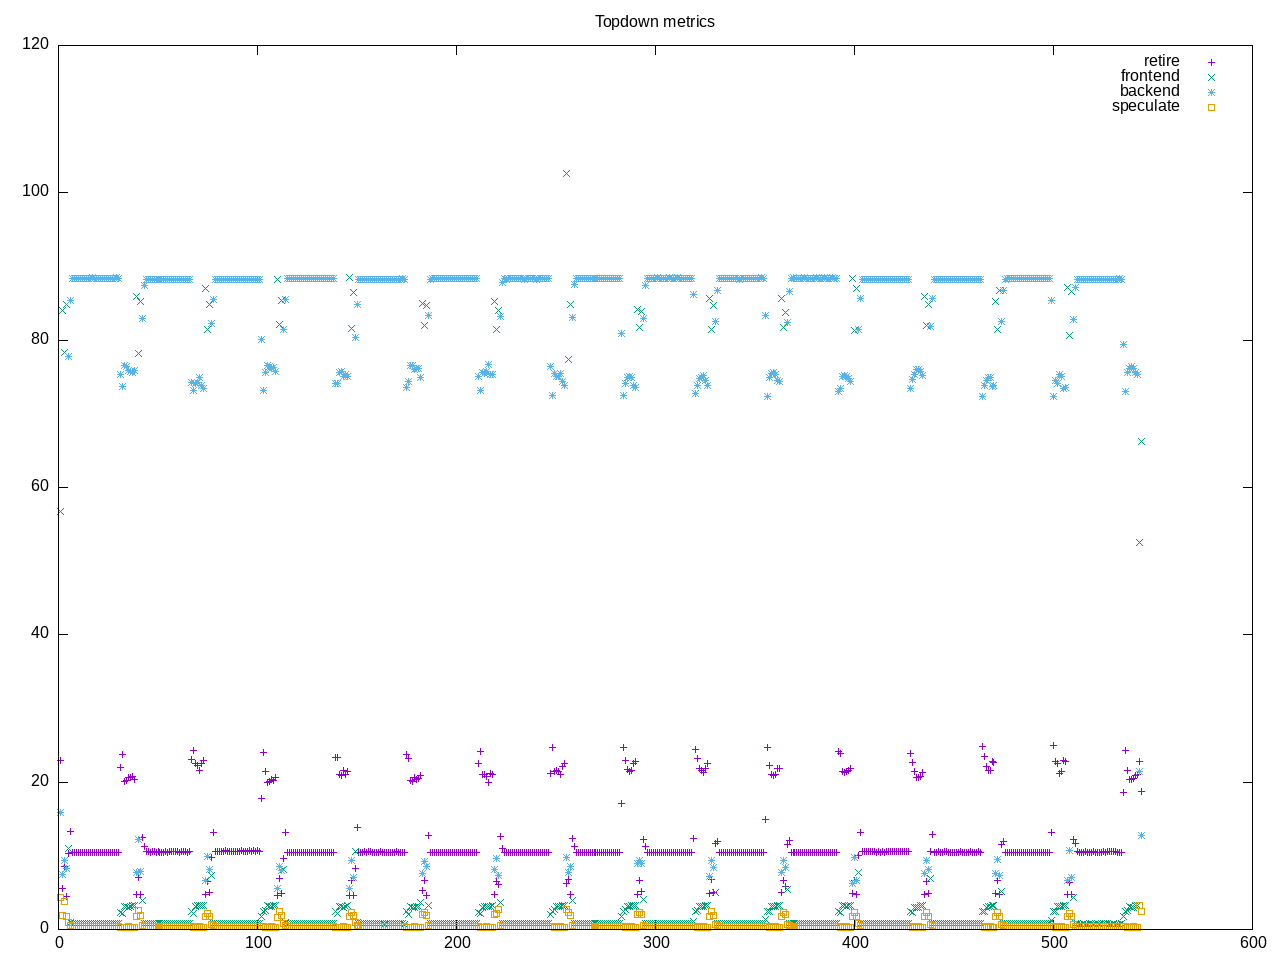
AMD metrics show an average of only 3.5 cores. This is floating point code with few branch misses. Frontend stalls are low and backend stalls are high.
elapsed              546.949
on_cpu               0.218          # 3.49 / 16 cores
utime                1904.013
stime                2.173
nvcsw                16236          # 51.16%
nivcsw               15499          # 48.84%
inblock              0              # 0.00/sec
onblock              2056           # 3.76/sec
cpu-clock            1906902816556  # 1906.903 seconds
task-clock           1906923992083  # 1906.924 seconds
page faults          138839         # 72.808/sec
context switches     34302          # 17.988/sec
cpu migrations       339            # 0.178/sec
major page faults    0              # 0.000/sec
minor page faults    138839         # 72.808/sec
alignment faults     0              # 0.000/sec
emulation faults     0              # 0.000/sec
branches             773040432866   # 112.899 branches per 1000 inst
branch misses        1708677115     # 0.22% branch miss
conditional          770588283706   # 112.540 conditional branches per 1000 inst
indirect             374106320      # 0.055 indirect branches per 1000 inst
cpu-cycles           1692125537767  # 0.94 GHz
instructions         1370561071471  # 0.81 IPC
slots                3386944277190  #
retiring             409289835857   # 12.1% (18.2%)
-- ucode             463432023      #     0.0%
-- fastpath          408826403834   #    12.1%
frontend             52934629700    #  1.6% ( 2.4%) low
-- latency           26013781506    #     0.8%
-- bandwidth         26920848194    #     0.8%
backend              1774101880707  # 52.4% (79.0%) high
-- cpu               635790079324   #    18.8%
-- memory            1138311801383  #    33.6%
speculation          8381426298     #  0.2% ( 0.4%) low
-- branch mispredict 7898633078     #     0.2%
-- pipeline restart  482793220      #     0.0%
smt-contention       1142234822831  # 33.7% ( 0.0%)
cpu-cycles           1697637019615  # 0.95 GHz
instructions         1372189486239  # 0.81 IPC
instructions         456767926414   # 142.516 l2 access per 1000 inst
l2 hit from l1       26648010394    # 44.94% l2 miss
l2 miss from l1      1513928287     #
l2 hit from l2 pf    10710793952    #
l3 hit from l2 pf    25090146143    #
l3 miss from l2 pf   2647865317     #
instructions         457188883424   # 329.247 float per 1000 inst
float 512            72             # 0.000 AVX-512 per 1000 inst
float 256            344            # 0.000 AVX-256 per 1000 inst
float 128            150528050110   # 329.247 AVX-128 per 1000 inst
float MMX            0              # 0.000 MMX per 1000 inst
float scalar         0              # 0.000 scalar per 1000 inst
instructions         2390641        #
opcache              897366         # 375.366 opcache per 1000 inst
opcache miss         478333         # 53.3% opcache miss rate
l1 dTLB miss         5470           # 2.288 L1 dTLB per 1000 inst
l2 dTLB miss         1094           # 0.458 L2 dTLB per 1000 inst
instructions         2418972        #
icache               1193224        # 493.277 icache per 1000 inst
icache miss          111159         #  9.3% icache miss rate
l1 iTLB miss         7              # 0.003 L1 iTLB per 1000 inst
l2 iTLB miss         0              # 0.000 L2 iTLB per 1000 inst
tlb flush            19             # 0.008 TLB flush per 1000 inst
Intel metrics are much quicker, looks like the AMD version needs multiple runs to reduce tolerance.
elapsed              115.355
on_cpu               0.318          # 5.08 / 16 cores
utime                585.447
stime                0.776
nvcsw                4673           # 48.25%
nivcsw               5012           # 51.75%
inblock              616            # 5.34/sec
onblock              1416           # 12.28/sec
cpu-clock            586340601288   # 586.341 seconds
task-clock           586347075893   # 586.347 seconds
page faults          152353         # 259.834/sec
context switches     10093          # 17.213/sec
cpu migrations       421            # 0.718/sec
major page faults    2              # 0.003/sec
minor page faults    152351         # 259.831/sec
alignment faults     0              # 0.000/sec
emulation faults     0              # 0.000/sec
branches             157824839681   # 114.070 branches per 1000 inst
branch misses        328274560      # 0.21% branch miss
conditional          157824853057   # 114.070 conditional branches per 1000 inst
indirect             47055770829    # 34.010 indirect branches per 1000 inst
slots                10662556995632 #
retiring             2005207474450  # 18.8% (18.8%)
-- ucode             38968677224    #     0.4%
-- fastpath          1966238797226  #    18.4%
frontend             1142542081923  # 10.7% (10.7%)
-- latency           1027167896973  #     9.6%
-- bandwidth         115374184950   #     1.1%
backend              7477821619753  # 70.1% (70.1%) high
-- cpu               4816740097479  #    45.2%
-- memory            2661081522274  #    25.0%
speculation          51623307331    #  0.5% ( 0.5%) low
-- branch mispredict 48674846500    #     0.5%
-- pipeline restart  2948460831     #     0.0%
smt-contention       0              #  0.0% ( 0.0%)
cpu-cycles           1389467375584  # 0.74 GHz
instructions         1100892371408  # 0.79 IPC
l2 access            104540813869   # 108.996 l2 access per 1000 inst
l2 miss              55139555141    # 52.74% l2 miss
cpu-cycles           1612435730781  # 32.1% memory latency
load stalls          517933116525   # 17.9% l1 bound
l1 miss              229865098888   #  4.7% l2 bound
l2 miss              154331027827   #  5.8% l3 bound
l3 miss              60457495909    #  3.7% dram bound
store_stalls         315269774      #  0.0% store bound
Process overview shows most of the time in clomp-build.
293 processes
	 48 clomp_build           6106.56     6.88
	 38 vulkaninfo               1.31     0.95
	  6 glxinfo:gdrv0            0.14     0.10
	  4 vulkani:disk$0           0.13     0.10
	  6 php                      0.07     0.05
	  2 llvmpipe-0               0.07     0.05
	  2 llvmpipe-1               0.07     0.05
	  2 llvmpipe-10              0.07     0.05
	  2 llvmpipe-11              0.07     0.05
	  2 llvmpipe-12              0.07     0.05
	  2 llvmpipe-13              0.07     0.05
	  2 llvmpipe-14              0.07     0.05
	  2 llvmpipe-15              0.07     0.05
	  2 llvmpipe-2               0.07     0.05
	  2 llvmpipe-3               0.07     0.05
	  2 llvmpipe-4               0.07     0.05
	  2 llvmpipe-5               0.07     0.05
	  2 llvmpipe-6               0.07     0.05
	  2 llvmpipe-7               0.07     0.05
	  2 llvmpipe-8               0.07     0.05
	  2 llvmpipe-9               0.07     0.05
	  2 glxinfo                  0.06     0.04
	  2 glxinfo:cs0              0.06     0.04
	  2 glxinfo:disk$0           0.06     0.04
	  2 glxinfo:sh0              0.06     0.04
	  2 glxinfo:shlo0            0.06     0.04
	  1 lspci                    0.01     0.01
	  1 ps                       0.00     0.01
	 66 sh                       0.00     0.00
	 13 gcc                      0.00     0.00
	  8 gsettings                0.00     0.00
	  8 stat                     0.00     0.00
	  8 systemd-detect-          0.00     0.00
	  5 gmain                    0.00     0.00
	  5 phoronix-test-s          0.00     0.00
	  3 clomp                    0.00     0.00
	  3 dconf worker             0.00     0.00
	  2 cc                       0.00     0.00
	  2 lscpu                    0.00     0.00
	  2 uname                    0.00     0.00
	  2 which                    0.00     0.00
	  2 xset                     0.00     0.00
	  1 date                     0.00     0.00
	  1 dirname                  0.00     0.00
	  1 dmesg                    0.00     0.00
	  1 dmidecode                0.00     0.00
	  1 grep                     0.00     0.00
	  1 ifconfig                 0.00     0.00
	  1 ip                       0.00     0.00
	  1 lsmod                    0.00     0.00
	  1 mktemp                   0.00     0.00
	  1 readlink                 0.00     0.00
	  1 realpath                 0.00     0.00
	  1 sed                      0.00     0.00
	  1 sort                     0.00     0.00
	  1 stty                     0.00     0.00
	  1 systemctl                0.00     0.00
	  1 template.sh              0.00     0.00
	  1 wc                       0.00     0.00
	  1 xrandr                   0.00     0.00
0 processes running
47 maximum processes
Computation blocks
      83118) clomp            cpu=3 start=4.90  finish=36.81
        83119) clomp_build      cpu=13 start=4.90  finish=36.81
          83120) clomp_build      cpu=15 start=4.90  finish=36.81
          83121) clomp_build      cpu=0 start=4.90  finish=36.81
          83122) clomp_build      cpu=14 start=4.90  finish=36.81
          83123) clomp_build      cpu=4 start=4.90  finish=36.81
          83124) clomp_build      cpu=9 start=4.90  finish=36.81
          83125) clomp_build      cpu=10 start=4.90  finish=36.81
          83126) clomp_build      cpu=3 start=4.90  finish=36.81
          83127) clomp_build      cpu=5 start=4.90  finish=36.81
          83128) clomp_build      cpu=1 start=4.90  finish=36.81
          83129) clomp_build      cpu=7 start=4.90  finish=36.81
          83130) clomp_build      cpu=8 start=4.90  finish=36.81
          83131) clomp_build      cpu=12 start=4.90  finish=36.81
          83132) clomp_build      cpu=6 start=4.90  finish=36.81
          83133) clomp_build      cpu=2 start=4.90  finish=36.81
          83134) clomp_build      cpu=11 start=4.90  finish=36.81