
Testing gzip with an archive of the Linux source tree. Relatively high frontend time and also higher than average speculation. Also interesting that none tests of different compression tools use the same metrics and workload so not easy to compare between tools.
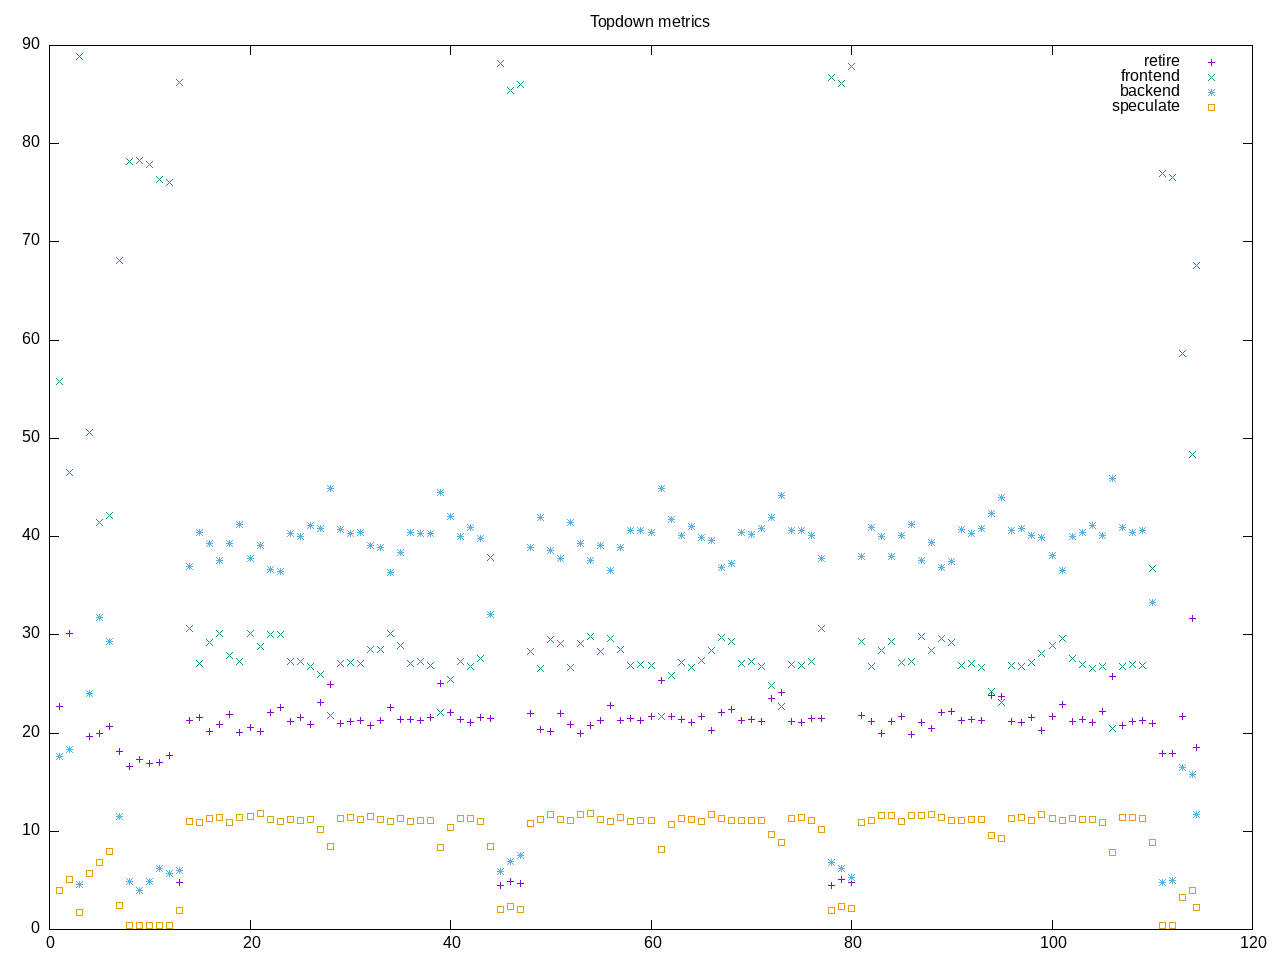
AMD metrics show this is a single threaded test with on_cpu = 0.97. Branch misprediction is ~10%
elapsed              114.506
on_cpu               0.061          # 0.97 / 16 cores
utime                91.441
stime                19.796
nvcsw                177298         # 98.96%
nivcsw               1867           # 1.04%
inblock              40             # 0.35/sec
onblock              7227360        # 63117.86/sec
cpu-clock            111006148726   # 111.006 seconds
task-clock           111095628310   # 111.096 seconds
page faults          153331         # 1380.171/sec
context switches     179526         # 1615.959/sec
cpu migrations       440            # 3.961/sec
major page faults    0              # 0.000/sec
minor page faults    153331         # 1380.171/sec
alignment faults     0              # 0.000/sec
emulation faults     0              # 0.000/sec
branches             137063645615   # 194.883 branches per 1000 inst
branch misses        6598040560     # 4.81% branch miss
conditional          118795025229   # 168.908 conditional branches per 1000 inst
indirect             130980107      # 0.186 indirect branches per 1000 inst
cpu-cycles           523296982865   # 0.29 GHz
instructions         704108543986   # 1.35 IPC
slots                1046083290948  #
retiring             222296651323   # 21.3% (21.3%)
-- ucode             133972432      #     0.0%
-- fastpath          222162678891   #    21.2%
frontend             334207248998   # 31.9% (32.0%)
-- latency           185991431652   #    17.8%
-- bandwidth         148215817346   #    14.2%
backend              384933199811   # 36.8% (36.8%)
-- cpu               79870268435    #     7.6%
-- memory            305062931376   #    29.2%
speculation          104151488257   # 10.0% (10.0%)
-- branch mispredict 104110788174   #    10.0%
-- pipeline restart  40700083       #     0.0%
smt-contention       494316794      #  0.0% ( 0.0%)
cpu-cycles           520290545671   # 0.27 GHz
instructions         700630953700   # 1.35 IPC
instructions         233734844896   # 65.940 l2 access per 1000 inst
l2 hit from l1       10143531840    # 1.32% l2 miss
l2 miss from l1      101054348      #
l2 hit from l2 pf    5165956737     #
l3 hit from l2 pf    52180456       #
l3 miss from l2 pf   50850081       #
instructions         234427107073   # 1.198 float per 1000 inst
float 512            69             # 0.000 AVX-512 per 1000 inst
float 256            62             # 0.000 AVX-256 per 1000 inst
float 128            280776469      # 1.198 AVX-128 per 1000 inst
float MMX            0              # 0.000 MMX per 1000 inst
float scalar         0              # 0.000 scalar per 1000 inst
Intel metrics
elapsed              135.102
on_cpu               0.060          # 0.95 / 16 cores
utime                115.671
stime                13.159
nvcsw                180106         # 99.24%
nivcsw               1374           # 0.76%
inblock              424            # 3.14/sec
onblock              7226968        # 53492.83/sec
cpu-clock            127195184462   # 127.195 seconds
task-clock           127350251510   # 127.350 seconds
page faults          148395         # 1165.251/sec
context switches     181959         # 1428.808/sec
cpu migrations       819            # 6.431/sec
major page faults    0              # 0.000/sec
minor page faults    148395         # 1165.251/sec
alignment faults     0              # 0.000/sec
emulation faults     0              # 0.000/sec
branches             133636627064   # 191.427 branches per 1000 inst
branch misses        4859420388     # 3.64% branch miss
conditional          133636639640   # 191.427 conditional branches per 1000 inst
indirect             299381650      # 0.429 indirect branches per 1000 inst
slots                2816999297276  #
retiring             640641585470   # 22.7% (22.7%)
-- ucode             29076199603    #     1.0%
-- fastpath          611565385867   #    21.7%
frontend             534785879010   # 19.0% (19.0%)
-- latency           175651233196   #     6.2%
-- bandwidth         359134645814   #    12.7%
backend              1033672078961  # 36.7% (36.7%)
-- cpu               541860874031   #    19.2%
-- memory            491811204930   #    17.5%
speculation          602880895949   # 21.4% (21.4%)
-- branch mispredict 602043399503   #    21.4%
-- pipeline restart  837496446      #     0.0%
smt-contention       0              #  0.0% ( 0.0%)
cpu-cycles           470155455895   # 0.22 GHz
instructions         698463029008   # 1.49 IPC
l2 access            18736530988    # 26.854 l2 access per 1000 inst
l2 miss              995215530      # 5.31% l2 miss
Process tree information shows only 4 instances of gzip and overall very short runtime the rest is mostly test suite overhead…
378 processes
	  4 gzip                    88.30     1.40
	 64 clinfo                  10.88     3.20
	  4 tar                      1.40     9.06
	 38 vulkaninfo               0.57     1.48
	  2 cp                       0.23     4.22
	  6 glxinfo:gdrv0            0.14     0.07
	  6 php                      0.08     0.17
	  4 vulkani:disk$0           0.06     0.15
	  2 glxinfo                  0.06     0.03
	  2 glxinfo:cs0              0.06     0.03
	  2 glxinfo:disk$0           0.06     0.03
	  2 glxinfo:sh0              0.06     0.03
	  2 glxinfo:shlo0            0.06     0.03
	  7 rm                       0.05     2.99
	  2 llvmpipe-0               0.03     0.08
	  2 llvmpipe-1               0.03     0.08
	  2 llvmpipe-10              0.03     0.08
	  2 llvmpipe-11              0.03     0.08
	  2 llvmpipe-12              0.03     0.08
	  2 llvmpipe-13              0.03     0.08
	  2 llvmpipe-14              0.03     0.08
	  2 llvmpipe-15              0.03     0.08
	  2 llvmpipe-2               0.03     0.08
	  2 llvmpipe-3               0.03     0.08
	  2 llvmpipe-4               0.03     0.08
	  2 llvmpipe-5               0.03     0.08
	  2 llvmpipe-6               0.03     0.08
	  2 llvmpipe-7               0.03     0.08
	  2 llvmpipe-8               0.03     0.08
	  2 llvmpipe-9               0.03     0.08
	  6 clang                    0.03     0.04
	  1 lspci                    0.00     0.03
	 95 sh                       0.00     0.00
	 12 gcc                      0.00     0.00
	  9 stty                     0.00     0.00
	  8 gsettings                0.00     0.00
	  8 stat                     0.00     0.00
	  8 systemd-detect-          0.00     0.00
	  6 llvm-link                0.00     0.00
	  5 gmain                    0.00     0.00
	  5 phoronix-test-s          0.00     0.00
	  4 bash                     0.00     0.00
	  3 compress-gzip            0.00     0.00
	  3 dconf worker             0.00     0.00
	  2 lscpu                    0.00     0.00
	  2 uname                    0.00     0.00
	  2 which                    0.00     0.00
	  2 xset                     0.00     0.00
	  1 cc                       0.00     0.00
	  1 date                     0.00     0.00
	  1 dirname                  0.00     0.00
	  1 dmesg                    0.00     0.00
	  1 dmidecode                0.00     0.00
	  1 grep                     0.00     0.00
	  1 ifconfig                 0.00     0.00
	  1 ip                       0.00     0.00
	  1 lsmod                    0.00     0.00
	  1 mktemp                   0.00     0.00
	  1 ps                       0.00     0.00
	  1 qdbus                    0.00     0.00
	  1 readlink                 0.00     0.00
	  1 realpath                 0.00     0.00
	  1 sed                      0.00     0.00
	  1 sort                     0.00     0.00
	  1 systemctl                0.00     0.00
	  1 template.sh              0.00     0.00
	  1 wc                       0.00     0.00
	  1 xrandr                   0.00     0.00
0 processes running
47 maximum processes
The core part of the benchmark is as follows
      30297) compress-gzip start=13.71 finish=43.18
        30298) tar start=13.71 finish=43.18
          30299) sh start=13.71 finish=43.18
            30300) gzip start=13.71 finish=43.18
      30301) sh start=43.18 finish=43.24
        30302) bash start=43.18 finish=43.24
          30303) rm start=43.18 finish=43.23
      30304) compress-gzip start=47.24 finish=76.22
        30305) tar start=47.24 finish=76.22
          30306) sh start=47.25 finish=76.22
            30307) gzip start=47.25 finish=76.21