
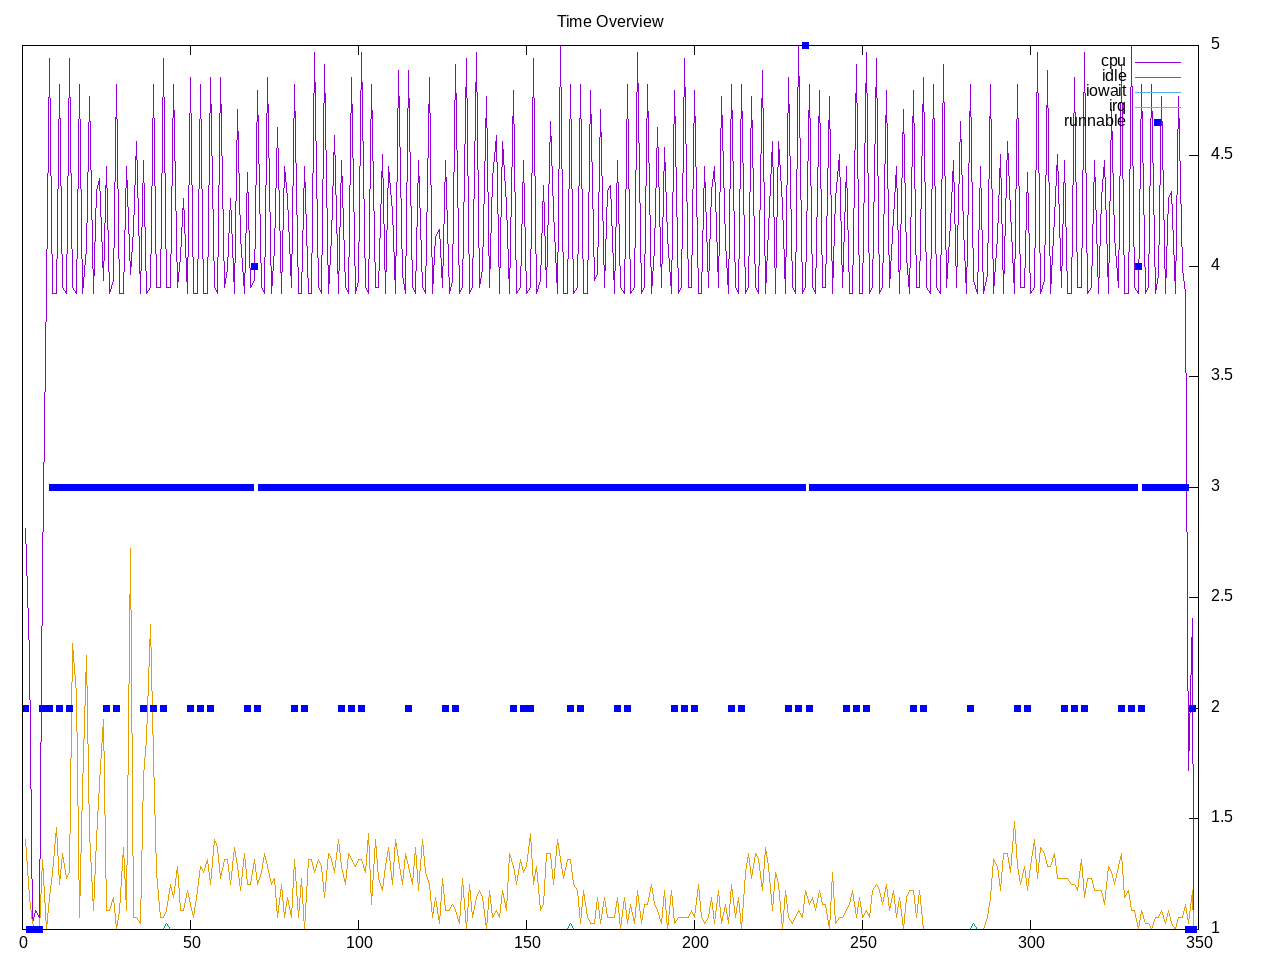
Shows the latency between various core combinations on the CPU. It runs for a while before concluding a single number (86.5ns on AMD and 146.2ns on Intel). Mostly three threads with a spiky usage profile and moderate level of interrupts.
Topdown profile shows more backend constraints with different phases.
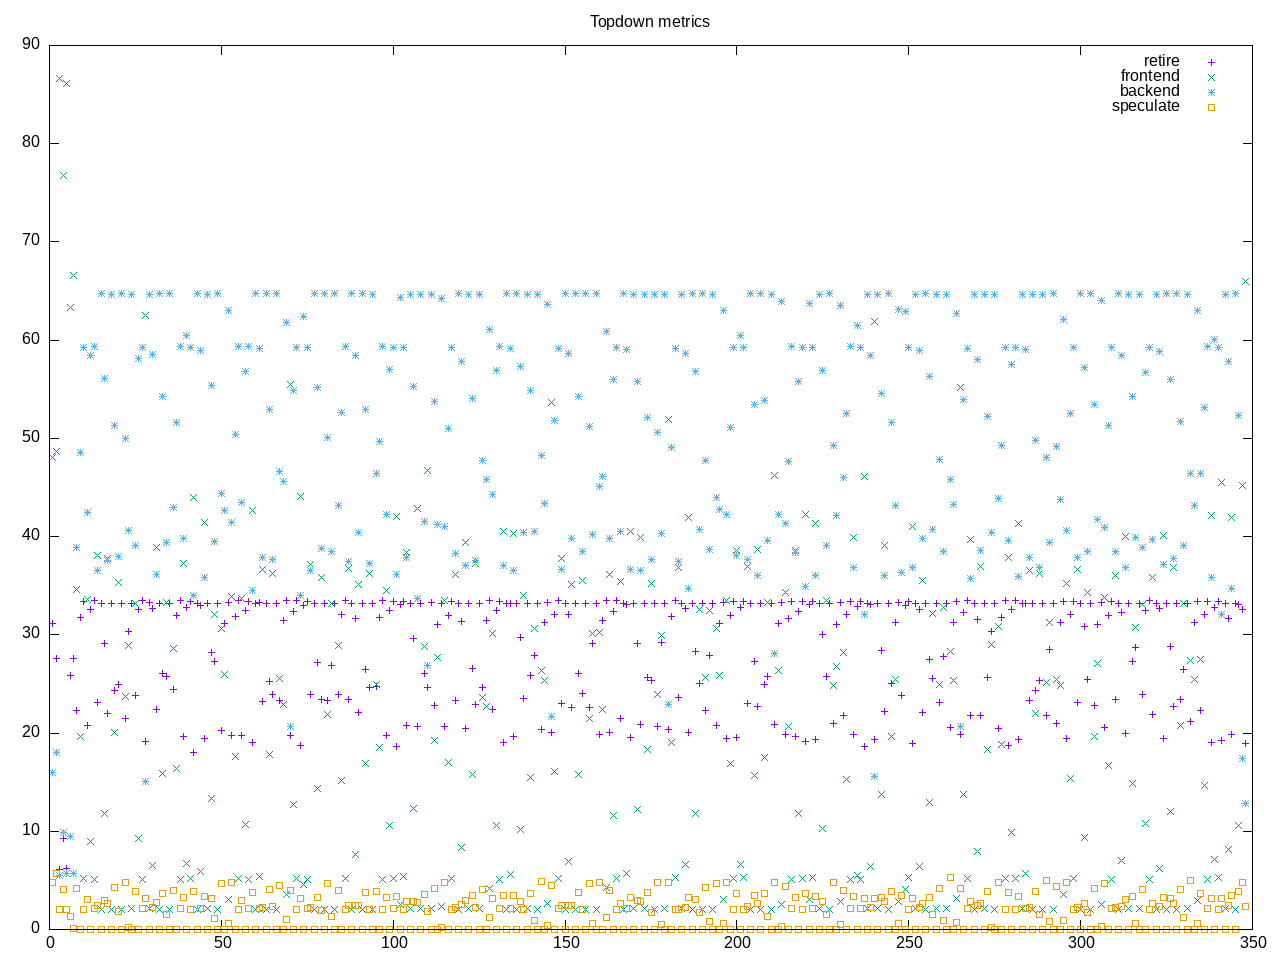
AMD metrics include almost no floating point, many branches, and reasonable backend stalls with 45% memory related stalls.
elapsed              347.624
on_cpu               0.068          # 1.09 / 16 cores
utime                377.052
stime                1.097
nvcsw                16947          # 34.74%
nivcsw               31834          # 65.26%
inblock              0              # 0.00/sec
onblock              12744          # 36.66/sec
cpu-clock            381605191602   # 381.605 seconds
task-clock           381632595433   # 381.633 seconds
page faults          366889         # 961.367/sec
context switches     50347          # 131.925/sec
cpu migrations       15123          # 39.627/sec
major page faults    2              # 0.005/sec
minor page faults    366887         # 961.362/sec
alignment faults     0              # 0.000/sec
emulation faults     0              # 0.000/sec
branches             1290084247883  # 317.431 branches per 1000 inst
branch misses        2376229821     # 0.18% branch miss
conditional          1262738703916  # 310.702 conditional branches per 1000 inst
indirect             7684465944     # 1.891 indirect branches per 1000 inst
cpu-cycles           1686373241655  # 0.30 GHz
instructions         4047814184336  # 2.40 IPC
slots                3570759217254  #
retiring             992216232198   # 27.8% (27.8%)
-- ucode             862926843      #     0.0%
-- fastpath          991353305355   #    27.8%
frontend             706977537808   # 19.8% (19.8%)
-- latency           398876251902   #    11.2%
-- bandwidth         308101285906   #     8.6%
backend              1798308407946  # 50.4% (50.4%)
-- cpu               187178390007   #     5.2%
-- memory            1611130017939  #    45.1%
speculation          69693310609    #  2.0% ( 2.0%)
-- branch mispredict 48349557225    #     1.4%
-- pipeline restart  21343753384    #     0.6%
smt-contention       3562760504     #  0.1% ( 0.0%)
cpu-cycles           1707892632149  # 0.30 GHz
instructions         4094199228615  # 2.40 IPC
instructions         1350541887660  # 0.776 l2 access per 1000 inst
l2 hit from l1       1004371938     # 67.46% l2 miss
l2 miss from l1      682022950      #
l2 hit from l2 pf    18820367       #
l3 hit from l2 pf    10453741       #
l3 miss from l2 pf   14761656       #
instructions         1353828518705  # 3.712 float per 1000 inst
float 512            46             # 0.000 AVX-512 per 1000 inst
float 256            384            # 0.000 AVX-256 per 1000 inst
float 128            5025323444     # 3.712 AVX-128 per 1000 inst
float MMX            0              # 0.000 MMX per 1000 inst
float scalar         13             # 0.000 scalar per 1000 inst
instructions         4069008521799  #
opcache              259340881921   # 63.736 opcache per 1000 inst
opcache miss         2342524413     #  0.9% opcache miss rate
l1 dTLB miss         33936466       # 0.008 L1 dTLB per 1000 inst
l2 dTLB miss         6530737        # 0.002 L2 dTLB per 1000 inst
instructions         4089180366000  #
icache               4014925148     # 0.982 icache per 1000 inst
icache miss          330099304      #  8.2% icache miss rate
l1 iTLB miss         8820947        # 0.002 L1 iTLB per 1000 inst
l2 iTLB miss         0              # 0.000 L2 iTLB per 1000 inst
Intel metrics show this fits in L3 and interestingly is more cpu-bound than memory-bound in contrast to the AMD processor.
elapsed              338.064
on_cpu               0.068          # 1.09 / 16 cores
utime                366.068
stime                0.844
nvcsw                16599          # 34.41%
nivcsw               31636          # 65.59%
inblock              8              # 0.02/sec
onblock              1496           # 4.43/sec
cpu-clock            369575801564   # 369.576 seconds
task-clock           369591458164   # 369.591 seconds
page faults          557191         # 1507.586/sec
context switches     49764          # 134.646/sec
cpu migrations       14929          # 40.393/sec
major page faults    0              # 0.000/sec
minor page faults    557191         # 1507.586/sec
alignment faults     0              # 0.000/sec
emulation faults     0              # 0.000/sec
branches             1488546243170  # 320.204 branches per 1000 inst
branch misses        2105739450     # 0.14% branch miss
conditional          1488546728162  # 320.204 conditional branches per 1000 inst
indirect             170666966807   # 36.713 indirect branches per 1000 inst
slots                5976172192742  #
retiring             3048896025037  # 51.0% (51.0%)
-- ucode             73313850447    #     1.2%
-- fastpath          2975582174590  #    49.8%
frontend             415667801674   #  7.0% ( 7.0%)
-- latency           134077085418   #     2.2%
-- bandwidth         281590716256   #     4.7%
backend              2284255214220  # 38.2% (38.2%)
-- cpu               1853685353998  #    31.0%
-- memory            430569860222   #     7.2%
speculation          229582167842   #  3.8% ( 3.8%)
-- branch mispredict 208351532527   #     3.5%
-- pipeline restart  21230635315    #     0.4%
smt-contention       0              #  0.0% ( 0.0%)
cpu-cycles           999791035793   # 0.18 GHz
instructions         4168346020829  # 4.17 IPC high
l2 access            1082001631     # 0.260 l2 access per 1000 inst
l2 miss              736658180      # 68.08% l2 miss
cpu-cycles           997555573602   #  9.8% memory latency
load stalls          97736959756    #  0.3% l1 bound
l1 miss              94948090517    #  1.4% l2 bound
l2 miss              81224075073    #  8.1% l3 bound
l3 miss              330804862      #  0.0% dram bound
store_stalls         509402552      #  0.1% store bound
Process overview shows ~15k versions of the core-latency process. Each of these runs for a very short time.
15322 processes
	14976 core-latency         1535299.29  6920.82
	 68 clinfo                  15.87     6.98
	 38 vulkaninfo               1.71     0.95
	  4 vulkani:disk$0           0.18     0.10
	  6 glxinfo:gdrv0            0.11     0.07
	  6 glxinfo:gl0              0.11     0.07
	  2 llvmpipe-0               0.09     0.05
	  2 llvmpipe-1               0.09     0.05
	  2 llvmpipe-10              0.09     0.05
	  2 llvmpipe-11              0.09     0.05
	  2 llvmpipe-12              0.09     0.05
	  2 llvmpipe-13              0.09     0.05
	  2 llvmpipe-14              0.09     0.05
	  2 llvmpipe-15              0.09     0.05
	  2 llvmpipe-2               0.09     0.05
	  2 llvmpipe-3               0.09     0.05
	  2 llvmpipe-4               0.09     0.05
	  2 llvmpipe-5               0.09     0.05
	  2 llvmpipe-6               0.09     0.05
	  2 llvmpipe-7               0.09     0.05
	  2 llvmpipe-8               0.09     0.05
	  2 llvmpipe-9               0.09     0.05
	  6 php                      0.08     0.06
	  6 clang                    0.06     0.06
	  2 glxinfo                  0.05     0.03
	  2 glxinfo:cs0              0.05     0.03
	  2 glxinfo:disk$0           0.05     0.03
	  2 glxinfo:sh0              0.05     0.03
	  2 glxinfo:shlo0            0.05     0.03
	  3 rocminfo                 0.03     0.00
	  1 lspci                    0.00     0.03
	 80 sh                       0.00     0.00
	 13 gcc                      0.00     0.00
	  8 stat                     0.00     0.00
	  8 systemd-detect-          0.00     0.00
	  7 gsettings                0.00     0.00
	  6 llvm-link                0.00     0.00
	  5 gmain                    0.00     0.00
	  5 phoronix-test-s          0.00     0.00
	  4 dconf worker             0.00     0.00
	  2 cc                       0.00     0.00
	  2 lscpu                    0.00     0.00
	  2 uname                    0.00     0.00
	  2 which                    0.00     0.00
	  2 xset                     0.00     0.00
	  1 date                     0.00     0.00
	  1 dirname                  0.00     0.00
	  1 dmesg                    0.00     0.00
	  1 dmidecode                0.00     0.00
	  1 grep                     0.00     0.00
	  1 ifconfig                 0.00     0.00
	  1 ip                       0.00     0.00
	  1 lsmod                    0.00     0.00
	  1 mktemp                   0.00     0.00
	  1 ps                       0.00     0.00
	  1 qdbus                    0.00     0.00
	  1 readlink                 0.00     0.00
	  1 realpath                 0.00     0.00
	  1 sed                      0.00     0.00
	  1 sort                     0.00     0.00
	  1 stty                     0.00     0.00
	  1 systemctl                0.00     0.00
	  1 template.sh              0.00     0.00
	  1 wc                       0.00     0.00
	  1 xrandr                   0.00     0.00
0 processes running
47 maximum processes