
A quick running example of the cython interpeter using the n-queens workload. The test is single-threaded and runs in ~20 seconds.

Topdown profile suggests a high retirement rate and some backend stalls
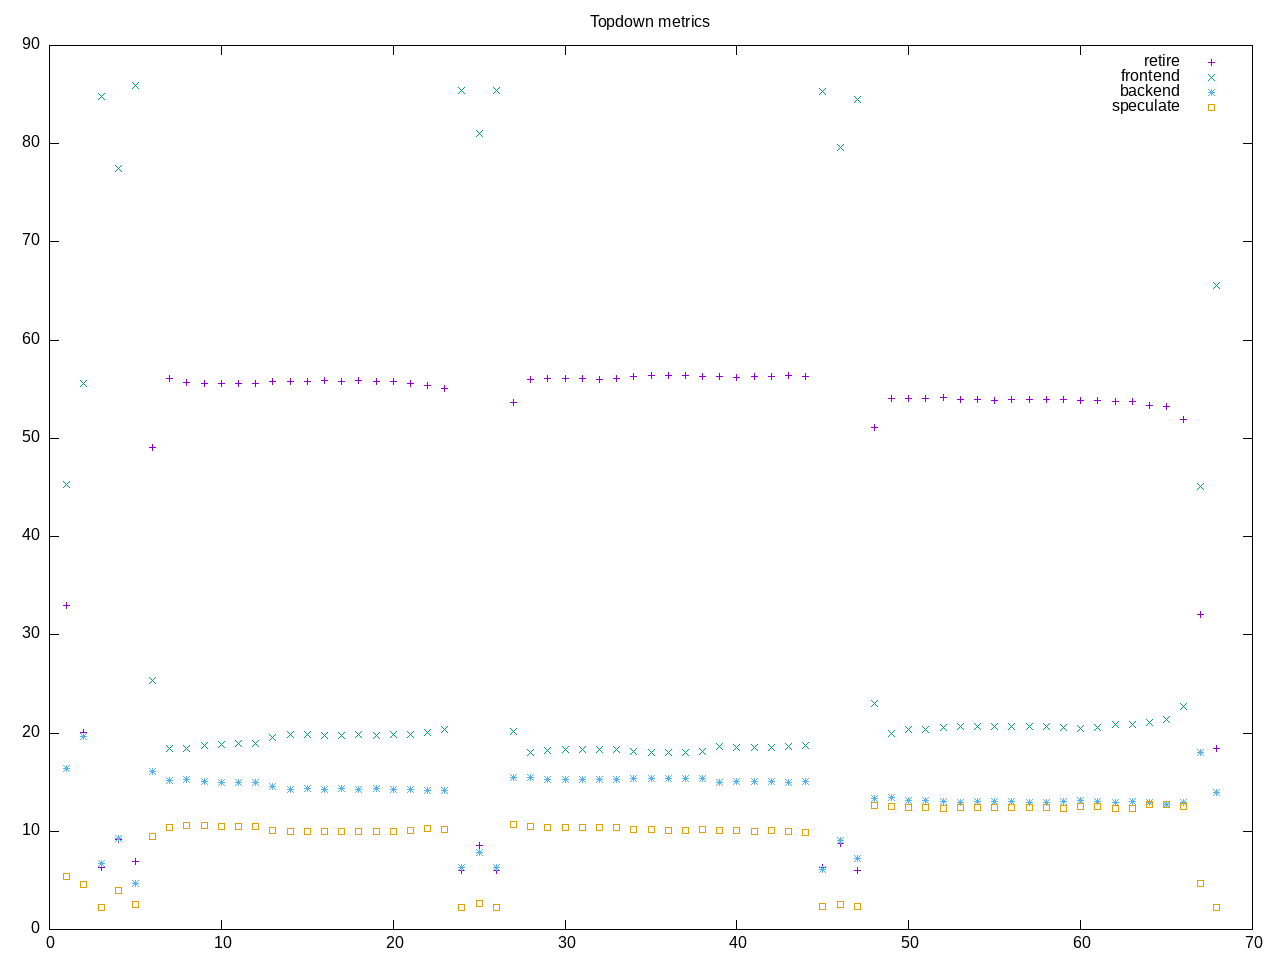
AMD metrics show little floating point and high backend stalls
elapsed              67.939
on_cpu               0.049          # 0.78 / 16 cores
utime                52.314
stime                0.756
nvcsw                2051           # 83.07%
nivcsw               418            # 16.93%
inblock              32             # 0.47/sec
onblock              12792          # 188.29/sec
cpu-clock            53091178724    # 53.091 seconds
task-clock           53093891724    # 53.094 seconds
page faults          150769         # 2839.668/sec
context switches     2635           # 49.629/sec
cpu migrations       285            # 5.368/sec
major page faults    2              # 0.038/sec
minor page faults    150767         # 2839.630/sec
alignment faults     0              # 0.000/sec
emulation faults     0              # 0.000/sec
branches             170004081415   # 211.601 branches per 1000 inst
branch misses        1305434728     # 0.77% branch miss
conditional          124187206181   # 154.573 conditional branches per 1000 inst
indirect             13921946370    # 17.328 indirect branches per 1000 inst
cpu-cycles           1046008726399  # 0.23 GHz
instructions         3443358962832  # 3.29 IPC high
slots                2098017000798  #
retiring             1155054414132  # 55.1% (55.1%) high
-- ucode             673958914      #     0.0%
-- fastpath          1154380455218  #    55.0%
frontend             413292672034   # 19.7% (19.7%)
-- latency           245604816006   #    11.7%
-- bandwidth         167687856028   #     8.0%
backend              314355791717   # 15.0% (15.0%) low
-- cpu               59950768323    #     2.9%
-- memory            254405023394   #    12.1%
speculation          215245053961   # 10.3% (10.3%) high
-- branch mispredict 174245301803   #     8.3%
-- pipeline restart  40999752158    #     2.0%
smt-contention       68804656       #  0.0% ( 0.0%)
cpu-cycles           247390165646   # 0.22 GHz
instructions         799729473282   # 3.23 IPC high
instructions         267707014735   # 1.746 l2 access per 1000 inst
l2 hit from l1       450707306      # 4.58% l2 miss
l2 miss from l1      11826992       #
l2 hit from l2 pf    7245387        #
l3 hit from l2 pf    3928618        #
l3 miss from l2 pf   5639194        #
instructions         267252045787   # 11.900 float per 1000 inst
float 512            63             # 0.000 AVX-512 per 1000 inst
float 256            628            # 0.000 AVX-256 per 1000 inst
float 128            3180169924     # 11.900 AVX-128 per 1000 inst
float MMX            0              # 0.000 MMX per 1000 inst
float scalar         6              # 0.000 scalar per 1000 inst
instructions         2692907        #
opcache              999972         # 371.336 opcache per 1000 inst
opcache miss         537113         # 53.7% opcache miss rate
l1 dTLB miss         6208           # 2.305 L1 dTLB per 1000 inst
l2 dTLB miss         1288           # 0.478 L2 dTLB per 1000 inst
instructions         2707712        #
icache               1285731        # 474.840 icache per 1000 inst
icache miss          109556         #  8.5% icache miss rate
l1 iTLB miss         11             # 0.004 L1 iTLB per 1000 inst
l2 iTLB miss         0              # 0.000 L2 iTLB per 1000 inst
tlb flush            19             # 0.007 TLB flush per 1000 inst
Intel metricfs
elapsed              73.454
on_cpu               0.051          # 0.81 / 16 cores
utime                59.236
stime                0.413
nvcsw                1417           # 80.28%
nivcsw               348            # 19.72%
inblock              648            # 8.82/sec
onblock              1360           # 18.51/sec
cpu-clock            59661572578    # 59.662 seconds
task-clock           59663943454    # 59.664 seconds
page faults          132647         # 2223.236/sec
context switches     1964           # 32.918/sec
cpu migrations       247            # 4.140/sec
major page faults    4              # 0.067/sec
minor page faults    132643         # 2223.169/sec
alignment faults     0              # 0.000/sec
emulation faults     0              # 0.000/sec
branches             169463250010   # 210.583 branches per 1000 inst
branch misses        1238803250     # 0.73% branch miss
conditional          169463260730   # 210.583 conditional branches per 1000 inst
indirect             13917096254    # 17.294 indirect branches per 1000 inst
slots                1358973405050  #
retiring             764876383363   # 56.3% (56.3%) high
-- ucode             58405381892    #     4.3%
-- fastpath          706471001471   #    52.0%
frontend             270062862871   # 19.9% (19.9%)
-- latency           106202662237   #     7.8%
-- bandwidth         163860200634   #    12.1%
backend              102804963702   #  7.6% ( 7.6%) low
-- cpu               93061163093    #     6.8%
-- memory            9743800609     #     0.7%
speculation          219513323526   # 16.2% (16.2%) high
-- branch mispredict 170335667921   #    12.5%
-- pipeline restart  49177655605    #     3.6%
smt-contention       0              #  0.0% ( 0.0%)
cpu-cycles           225248160861   # 0.19 GHz
instructions         805041620058   # 3.57 IPC high
l2 access            397729579      # 0.495 l2 access per 1000 inst
l2 miss              83846088       # 21.08% l2 miss
cpu-cycles           223534667994   #  4.5% memory latency
load stalls          9976909069     #  4.0% l1 bound
l1 miss              1008580401     #  0.3% l2 bound
l2 miss              380699632      #  0.0% l3 bound
l3 miss              276044977      #  0.1% dram bound
store_stalls         70230668       #  0.0% store bound
Process summary shows this driven as a python process
355 processes
	  4 python3                 51.85     0.00
	 68 clinfo                  20.84     5.66
	 38 vulkaninfo               1.14     1.71
	  6 glxinfo:gdrv0            0.16     0.06
	  6 glxinfo:gl0              0.16     0.06
	  4 vulkani:disk$0           0.12     0.19
	  2 glxinfo                  0.08     0.02
	  2 glxinfo:cs0              0.08     0.02
	  2 glxinfo:disk$0           0.08     0.02
	  2 glxinfo:sh0              0.08     0.02
	  2 glxinfo:shlo0            0.08     0.02
	  2 llvmpipe-0               0.06     0.10
	  2 llvmpipe-1               0.06     0.10
	  2 llvmpipe-10              0.06     0.10
	  2 llvmpipe-11              0.06     0.10
	  2 llvmpipe-12              0.06     0.10
	  2 llvmpipe-13              0.06     0.10
	  2 llvmpipe-14              0.06     0.10
	  2 llvmpipe-15              0.06     0.10
	  2 llvmpipe-2               0.06     0.10
	  2 llvmpipe-3               0.06     0.10
	  2 llvmpipe-4               0.06     0.10
	  2 llvmpipe-5               0.06     0.10
	  2 llvmpipe-6               0.06     0.10
	  2 llvmpipe-7               0.06     0.10
	  2 llvmpipe-8               0.06     0.10
	  2 llvmpipe-9               0.06     0.10
	  6 php                      0.06     0.07
	  6 clang                    0.03     0.09
	  3 rocminfo                 0.03     0.03
	  1 lspci                    0.01     0.02
	  1 ps                       0.00     0.01
	 83 sh                       0.00     0.00
	 12 gcc                      0.00     0.00
	 10 gsettings                0.00     0.00
	  8 stat                     0.00     0.00
	  8 systemd-detect-          0.00     0.00
	  6 llvm-link                0.00     0.00
	  5 phoronix-test-s          0.00     0.00
	  4 gmain                    0.00     0.00
	  3 cython-bench             0.00     0.00
	  2 dconf worker             0.00     0.00
	  2 lscpu                    0.00     0.00
	  2 uname                    0.00     0.00
	  2 which                    0.00     0.00
	  2 xset                     0.00     0.00
	  1 cc                       0.00     0.00
	  1 date                     0.00     0.00
	  1 dirname                  0.00     0.00
	  1 dmesg                    0.00     0.00
	  1 dmidecode                0.00     0.00
	  1 grep                     0.00     0.00
	  1 ifconfig                 0.00     0.00
	  1 ip                       0.00     0.00
	  1 lsmod                    0.00     0.00
	  1 mktemp                   0.00     0.00
	  1 python                   0.00     0.00
	  1 qdbus                    0.00     0.00
	  1 readlink                 0.00     0.00
	  1 realpath                 0.00     0.00
	  1 sed                      0.00     0.00
	  1 sort                     0.00     0.00
	  1 stty                     0.00     0.00
	  1 systemctl                0.00     0.00
	  1 template.sh              0.00     0.00
	  1 wc                       0.00     0.00
	  1 xrandr                   0.00     0.00
0 processes running
47 maximum processes
Computation block
      756108) cython-bench     cpu=7 start=5.54  finish=22.51
        756109) python3          cpu=1 start=5.54  finish=22.50
      756113) cython-bench     cpu=1 start=26.51 finish=43.62
        756114) python3          cpu=2 start=26.51 finish=43.62
      756115) cython-bench     cpu=9 start=47.62 finish=65.43
        756116) python3          cpu=10 start=47.62 finish=65.42