
The Darmstadt Automotive Parallel Heterogeneous Benchmark Suite that tries benchmarks with OpenCL and OpenMP for automotive benchmarks. The OpenCL ones do not run. Most of these appear to be single-threaded despite the OpenMP indicator.

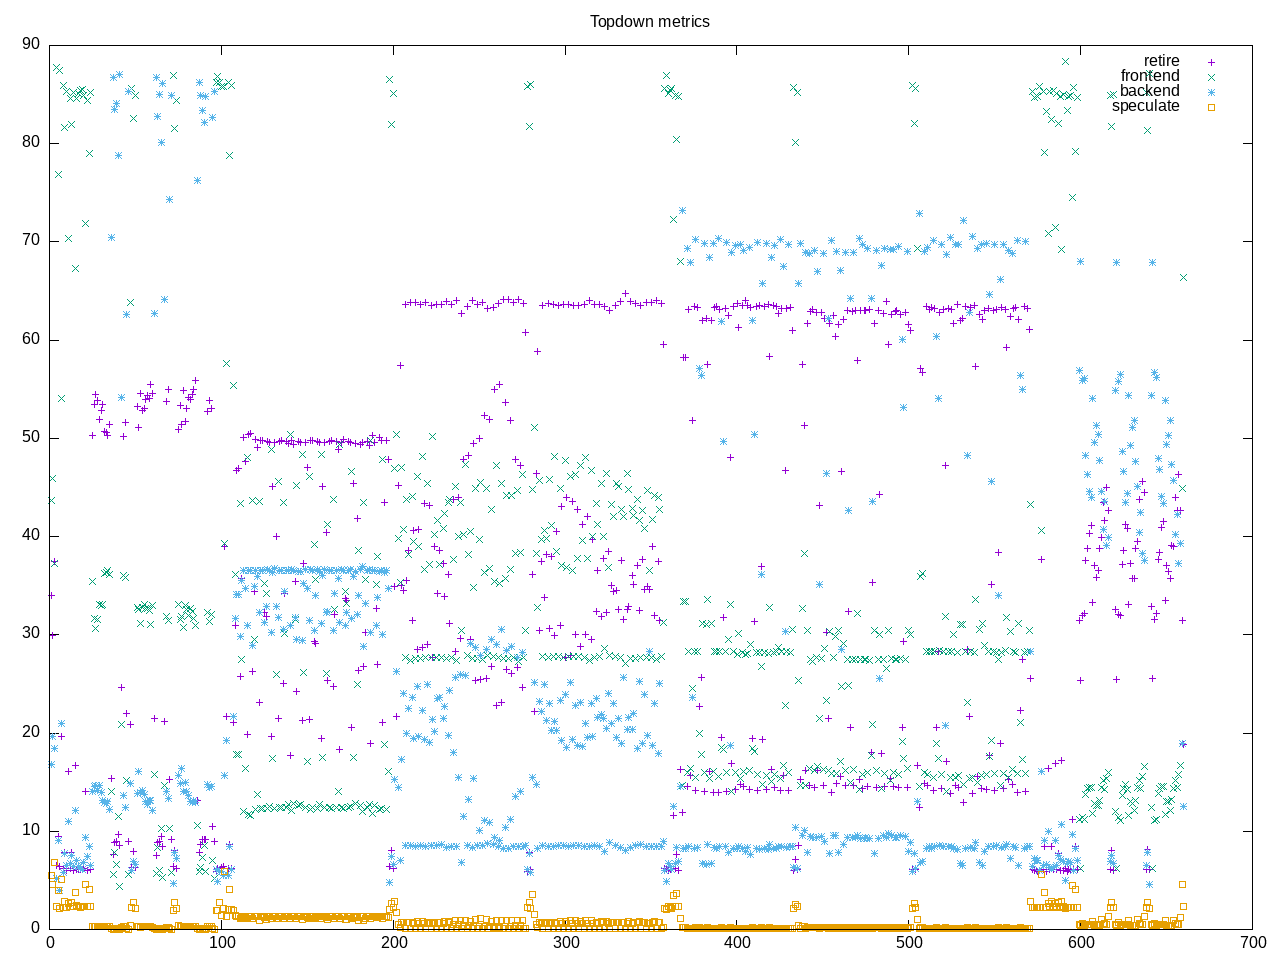
Topdown profile shows mix of retiring slots and backend stalls.
AMD metrics are a composite of the above showing not much floating point and low L2 access.
elapsed              647.523
on_cpu               0.143          # 2.29 / 16 cores
utime                1195.537
stime                284.194
nvcsw                1342214        # 9.73%
nivcsw               12450912       # 90.27%
inblock              277614544      # 428733.21/sec
onblock              35936          # 55.50/sec
cpu-clock            1480594180040  # 1480.594 seconds
task-clock           1481141930675  # 1481.142 seconds
page faults          84864057       # 57296.371/sec
context switches     13796149       # 9314.535/sec
cpu migrations       326886         # 220.699/sec
major page faults    150            # 0.101/sec
minor page faults    84863907       # 57296.269/sec
alignment faults     0              # 0.000/sec
emulation faults     0              # 0.000/sec
branches             1589971314596  # 177.095 branches per 1000 inst
branch misses        22901058854    # 1.44% branch miss
conditional          1003628468174  # 111.787 conditional branches per 1000 inst
indirect             161161234244   # 17.951 indirect branches per 1000 inst
cpu-cycles           6094697416325  # 0.59 GHz
instructions         8898725499100  # 1.46 IPC
slots                12168710168130 #
retiring             3221769683765  # 26.5% (32.7%)
-- ucode             25931388043    #     0.2%
-- fastpath          3195838295722  #    26.3%
frontend             2229448759160  # 18.3% (22.6%)
-- latency           1339052845638  #    11.0%
-- bandwidth         890395913522   #     7.3%
backend              4376772220333  # 36.0% (44.4%)
-- cpu               1570743126155  #    12.9%
-- memory            2806029094178  #    23.1%
speculation          32943244673    #  0.3% ( 0.3%) low
-- branch mispredict 32596017992    #     0.3%
-- pipeline restart  347226681      #     0.0%
smt-contention       2307718181346  # 19.0% ( 0.0%)
cpu-cycles           6142429904000  # 0.59 GHz
instructions         8913235202843  # 1.45 IPC
instructions         2969698292677  # 9.421 l2 access per 1000 inst
l2 hit from l1       19591167482    # 25.90% l2 miss
l2 miss from l1      1643216687     #
l2 hit from l2 pf    2783547056     #
l3 hit from l2 pf    1420250892     #
l3 miss from l2 pf   4182540997     #
instructions         2964104532232  # 58.608 float per 1000 inst
float 512            73             # 0.000 AVX-512 per 1000 inst
float 256            844            # 0.000 AVX-256 per 1000 inst
float 128            173721135233   # 58.608 AVX-128 per 1000 inst
float MMX            0              # 0.000 MMX per 1000 inst
float scalar         0              # 0.000 scalar per 1000 inst
instructions         8915527065582  #
opcache              1346487074649  # 151.027 opcache per 1000 inst
opcache miss         134602372282   # 10.0% opcache miss rate
l1 dTLB miss         2340482149     # 0.263 L1 dTLB per 1000 inst
l2 dTLB miss         614271217      # 0.069 L2 dTLB per 1000 inst
instructions         8904278828800  #
icache               310867012549   # 34.912 icache per 1000 inst
icache miss          9574737682     #  3.1% icache miss rate
l1 iTLB miss         60611547       # 0.007 L1 iTLB per 1000 inst
l2 iTLB miss         0              # 0.000 L2 iTLB per 1000 inst
tlb flush            239333         # 0.000 TLB flush per 1000 inst
Intel metrics
elapsed              1436.480
on_cpu               0.128          # 2.04 / 16 cores
utime                2636.012
stime                300.586
nvcsw                2152216        # 98.57%
nivcsw               31297          # 1.43%
inblock              554279288      # 385859.26/sec
onblock              2368           # 1.65/sec
cpu-clock            2930803533535  # 2930.804 seconds
task-clock           2931453232627  # 2931.453 seconds
page faults          120740962      # 41188.091/sec
context switches     2190497        # 747.239/sec
cpu migrations       12032          # 4.104/sec
major page faults    76             # 0.026/sec
minor page faults    120740886      # 41188.065/sec
alignment faults     0              # 0.000/sec
emulation faults     0              # 0.000/sec
branches             2498902996927  # 176.736 branches per 1000 inst
branch misses        1064616276     # 0.04% branch miss
conditional          2498903022559  # 176.736 conditional branches per 1000 inst
indirect             399913304330   # 28.284 indirect branches per 1000 inst
slots                41640024301754 #
retiring             8457987971296  # 20.3% (20.3%)
-- ucode             1333390304549  #     3.2%
-- fastpath          7124597666747  #    17.1%
frontend             5693102775992  # 13.7% (13.7%)
-- latency           3332728754447  #     8.0%
-- bandwidth         2360374021545  #     5.7%
backend              26553295817784 # 63.8% (63.8%)
-- cpu               22615742223392 #    54.3%
-- memory            3937553594392  #     9.5%
speculation          617223955381   #  1.5% ( 1.5%)
-- branch mispredict 342222801500   #     0.8%
-- pipeline restart  275001153881   #     0.7%
smt-contention       0              #  0.0% ( 0.0%)
cpu-cycles           17570217701955 # 0.46 GHz
instructions         31250072553799 # 1.78 IPC
l2 access            148699094152   # 7.007 l2 access per 1000 inst
l2 miss              96697170846    # 65.03% l2 miss
cpu-cycles           7587612284914  # 10.3% memory latency
load stalls          566094003027   #  4.0% l1 bound
l1 miss              261284310669   #  1.3% l2 bound
l2 miss              164160337975   #  0.9% l3 bound
l3 miss              93582661571    #  1.2% dram bound
store_stalls         217319060957   #  2.9% store bound
Process overview shows kernel is the primary driver
764 processes
	246 kernel               23220.31  7341.70
	204 clinfo                  50.68    21.18
	 38 vulkaninfo               1.31     1.33
	  4 vulkani:disk$0           0.14     0.14
	  6 php                      0.09     0.20
	  2 llvmpipe-0               0.07     0.07
	  2 llvmpipe-1               0.07     0.07
	  2 llvmpipe-10              0.07     0.07
	  2 llvmpipe-11              0.07     0.07
	  2 llvmpipe-12              0.07     0.07
	  2 llvmpipe-13              0.07     0.07
	  2 llvmpipe-14              0.07     0.07
	  2 llvmpipe-15              0.07     0.07
	  2 llvmpipe-2               0.07     0.07
	  2 llvmpipe-3               0.07     0.07
	  2 llvmpipe-4               0.07     0.07
	  2 llvmpipe-5               0.07     0.07
	  2 llvmpipe-6               0.07     0.07
	  2 llvmpipe-7               0.07     0.07
	  2 llvmpipe-8               0.07     0.07
	  2 llvmpipe-9               0.07     0.07
	  6 glxinfo:gdrv0            0.06     0.12
	  6 glxinfo:gl0              0.06     0.12
	  6 clang                    0.06     0.05
	  2 glxinfo                  0.04     0.04
	  2 glxinfo:cs0              0.04     0.04
	  2 glxinfo:disk$0           0.04     0.04
	  2 glxinfo:sh0              0.04     0.04
	  2 glxinfo:shlo0            0.04     0.04
	  3 rocminfo                 0.00     0.03
	  1 lspci                    0.00     0.02
	 92 sh                       0.00     0.00
	 24 daphne                   0.00     0.00
	 13 gcc                      0.00     0.00
	  9 gsettings                0.00     0.00
	  8 stat                     0.00     0.00
	  8 systemd-detect-          0.00     0.00
	  6 llvm-link                0.00     0.00
	  5 phoronix-test-s          0.00     0.00
	  4 gmain                    0.00     0.00
	  3 dconf worker             0.00     0.00
	  2 cc                       0.00     0.00
	  2 lscpu                    0.00     0.00
	  2 uname                    0.00     0.00
	  2 which                    0.00     0.00
	  2 xset                     0.00     0.00
	  1 date                     0.00     0.00
	  1 dirname                  0.00     0.00
	  1 dmesg                    0.00     0.00
	  1 dmidecode                0.00     0.00
	  1 grep                     0.00     0.00
	  1 ifconfig                 0.00     0.00
	  1 ip                       0.00     0.00
	  1 lsmod                    0.00     0.00
	  1 mktemp                   0.00     0.00
	  1 ps                       0.00     0.00
	  1 qdbus                    0.00     0.00
	  1 readlink                 0.00     0.00
	  1 realpath                 0.00     0.00
	  1 sed                      0.00     0.00
	  1 sort                     0.00     0.00
	  1 stty                     0.00     0.00
	  1 systemctl                0.00     0.00
	  1 template.sh              0.00     0.00
	  1 wc                       0.00     0.00
	  1 xrandr                   0.00     0.00
0 processes running
47 maximum processes
Computation block
      882112) daphne           cpu=4 start=24.47 finish=46.59
        882113) kernel           cpu=5 start=24.47 finish=46.52
          882114) kernel           cpu=14 start=35.86 finish=46.52
          882115) kernel           cpu=0 start=35.86 finish=46.52
          882116) kernel           cpu=8 start=35.86 finish=46.52
          882117) kernel           cpu=1 start=35.86 finish=46.52
          882118) kernel           cpu=2 start=35.86 finish=46.52
          882119) kernel           cpu=15 start=35.86 finish=46.52
          882120) kernel           cpu=10 start=35.86 finish=46.52
          882121) kernel           cpu=12 start=35.86 finish=46.52
          882122) kernel           cpu=6 start=35.86 finish=46.52
          882123) kernel           cpu=7 start=35.86 finish=46.52
          882124) kernel           cpu=11 start=35.86 finish=46.52
          882125) kernel           cpu=9 start=35.86 finish=46.52
          882126) kernel           cpu=4 start=35.86 finish=46.52
          882127) kernel           cpu=3 start=35.86 finish=46.52
          882128) kernel           cpu=13 start=35.86 finish=46.52