
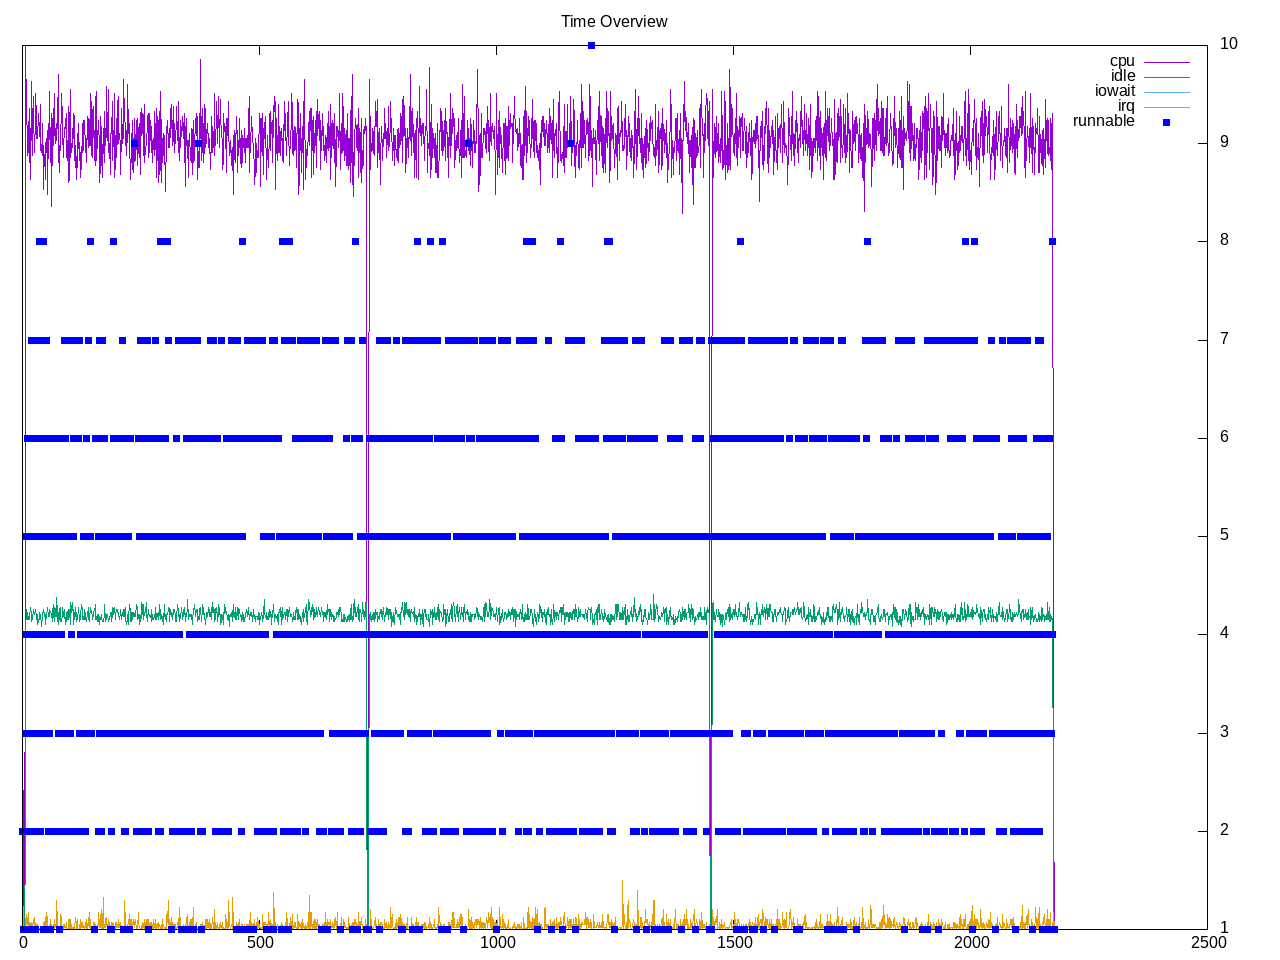
A test of file-system calls for testing disk performance. There are six different configurations and I picked the second smallest one. It produces one result. An interesting diviion of how many runnable processes up to the “6” I provided. Also a high amount of I/O wait as expected.
System profile shows that frontend stalls predominate.
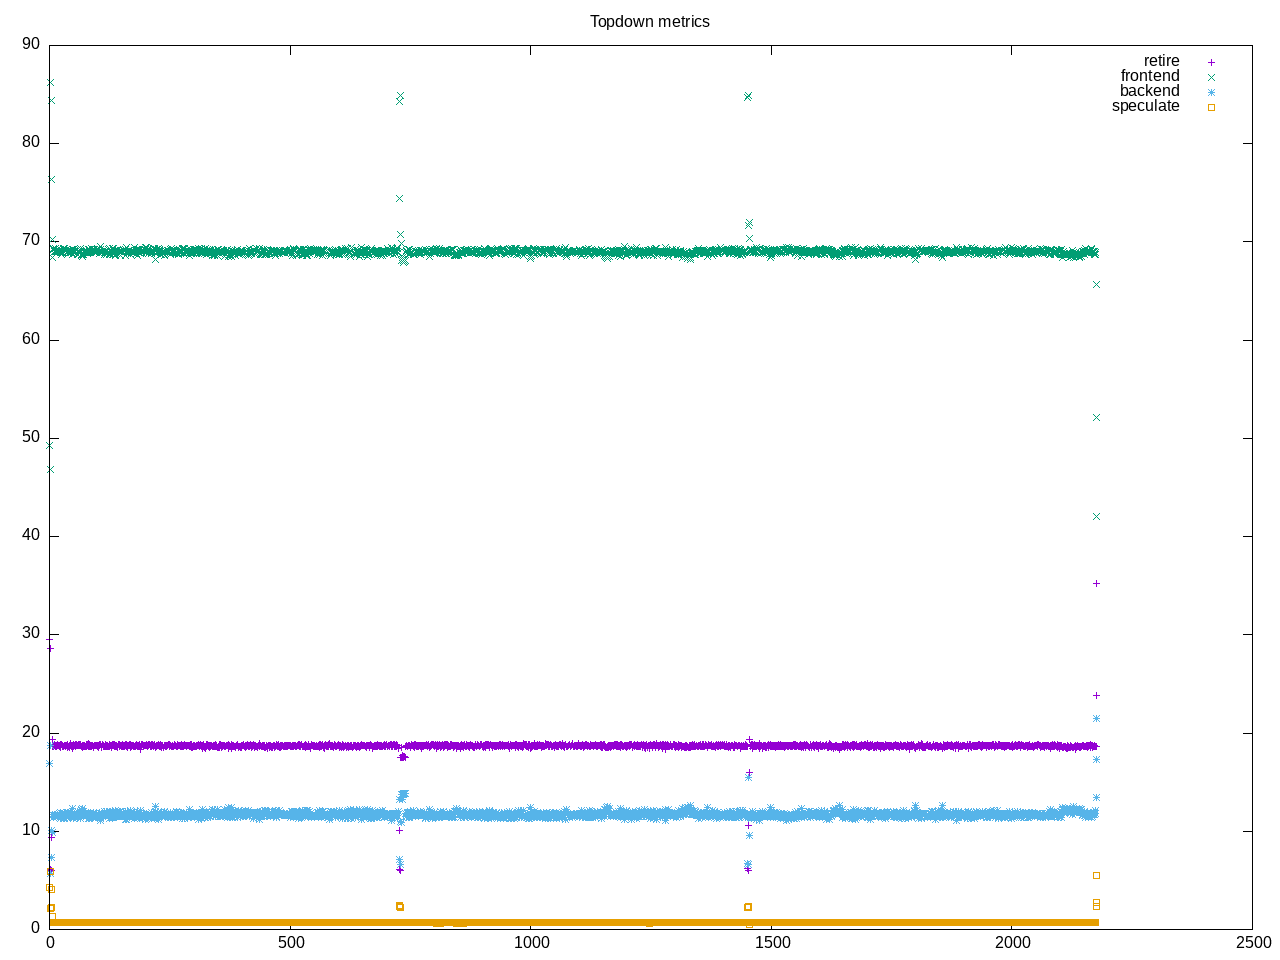
AMD metrics show a high frontend rate with a high opcache miss, not much floating point and medium L2 acces.
elapsed              2176.538
on_cpu               0.189          # 3.02 / 16 cores
utime                843.344
stime                5722.115
nvcsw                39343228       # 91.98%
nivcsw               3431889        # 8.02%
inblock              16             # 0.01/sec
onblock              1951980816     # 896828.18/sec
cpu-clock            6544199386258  # 6544.199 seconds
task-clock           6557405231180  # 6557.405 seconds
page faults          149116         # 22.740/sec
context switches     42785835       # 6524.812/sec
cpu migrations       246100         # 37.530/sec
major page faults    13             # 0.002/sec
minor page faults    149103         # 22.738/sec
alignment faults     0              # 0.000/sec
emulation faults     0              # 0.000/sec
branches             5369777313397  # 201.000 branches per 1000 inst
branch misses        498901061495   # 9.29% branch miss
conditional          2985957828338  # 111.770 conditional branches per 1000 inst
indirect             120006447001   # 4.492 indirect branches per 1000 inst
cpu-cycles           26885010670698 # 0.77 GHz
instructions         26691633015506 # 0.99 IPC
slots                53800271237178 #
retiring             9965806851258  # 18.5% (18.7%)
-- ucode             45841046628    #     0.1%
-- fastpath          9919965804630  #    18.4%
frontend             36762333555880 # 68.3% (68.9%) high
-- latency           30194936859138 #    56.1%
-- bandwidth         6567396696742  #    12.2%
backend              6261672572771  # 11.6% (11.7%) low
-- cpu               1445619174398  #     2.7%
-- memory            4816053398373  #     9.0%
speculation          368537694187   #  0.7% ( 0.7%) low
-- branch mispredict 368086932974   #     0.7%
-- pipeline restart  450761213      #     0.0%
smt-contention       441420103436   #  0.8% ( 0.0%)
cpu-cycles           26872006595681 # 0.77 GHz
instructions         26663335352982 # 0.99 IPC
instructions         8880068374203  # 63.906 l2 access per 1000 inst
l2 hit from l1       507717865287   # 12.11% l2 miss
l2 miss from l1      44342179500    #
l2 hit from l2 pf    35398150037    #
l3 hit from l2 pf    11069911894    #
l3 miss from l2 pf   13300450922    #
instructions         8889672813205  # 23.840 float per 1000 inst
float 512            60             # 0.000 AVX-512 per 1000 inst
float 256            404            # 0.000 AVX-256 per 1000 inst
float 128            211927312478   # 23.840 AVX-128 per 1000 inst
float MMX            0              # 0.000 MMX per 1000 inst
float scalar         0              # 0.000 scalar per 1000 inst
instructions         26623999186545 #
opcache              8116073436265  # 304.841 opcache per 1000 inst
opcache miss         4676200238691  # 57.6% opcache miss rate
l1 dTLB miss         47731066114    # 1.793 L1 dTLB per 1000 inst
l2 dTLB miss         1783025545     # 0.067 L2 dTLB per 1000 inst
instructions         26698545195061 #
icache               10188477109326 # 381.612 icache per 1000 inst
icache miss          1097498334140  # 10.8% icache miss rate
l1 iTLB miss         1220522879     # 0.046 L1 iTLB per 1000 inst
l2 iTLB miss         0              # 0.000 L2 iTLB per 1000 inst
tlb flush            59672          # 0.000 TLB flush per 1000 inst
Intel metrics
elapsed              2177.876
on_cpu               0.048          # 0.77 / 16 cores
utime                325.393
stime                1352.528
nvcsw                5320085        # 92.93%
nivcsw               404512         # 7.07%
inblock              1056           # 0.48/sec
onblock              273288160      # 125483.80/sec
cpu-clock            1631494311265  # 1631.494 seconds
task-clock           1639148551423  # 1639.149 seconds
page faults          139350         # 85.014/sec
context switches     5735488        # 3499.065/sec
cpu migrations       872210         # 532.112/sec
major page faults    2              # 0.001/sec
minor page faults    139347         # 85.012/sec
alignment faults     0              # 0.000/sec
emulation faults     0              # 0.000/sec
branches             587123993695   # 175.735 branches per 1000 inst
branch misses        4102810713     # 0.70% branch miss
conditional          587124006175   # 175.735 conditional branches per 1000 inst
indirect             66106187961    # 19.787 indirect branches per 1000 inst
slots                8690665163174  #
retiring             2837400948150  # 32.6% (32.6%)
-- ucode             338512018229   #     3.9%
-- fastpath          2498888929921  #    28.8%
frontend             2763739105775  # 31.8% (31.8%)
-- latency           1232575523042  #    14.2%
-- bandwidth         1531163582733  #    17.6%
backend              2728568799830  # 31.4% (31.4%)
-- cpu               999833389376   #    11.5%
-- memory            1728735410454  #    19.9%
speculation          269154958294   #  3.1% ( 3.1%)
-- branch mispredict 217893008638   #     2.5%
-- pipeline restart  51261949656    #     0.6%
smt-contention       0              #  0.0% ( 0.0%)
cpu-cycles           1917863811967  # 0.05 GHz
instructions         3664555557015  # 1.91 IPC
l2 access            153603328933   # 53.640 l2 access per 1000 inst
l2 miss              30185565429    # 19.65% l2 miss
cpu-cycles           1484726815764  # 25.0% memory latency
load stalls          344343365955   #  5.6% l1 bound
l1 miss              261227496127   #  7.8% l2 bound
l2 miss              144992619062   #  5.7% l3 bound
l3 miss              60295458648    #  4.1% dram bound
store_stalls         27032209086    #  1.8% store bound
Process profile
374 processes
	 24 dbench                 848.15  5644.25
	 68 clinfo                  16.53     6.65
	 38 vulkaninfo               1.52     0.95
	  6 php                      0.21     0.12
	  4 vulkani:disk$0           0.16     0.10
	  6 glxinfo:gdrv0            0.12     0.04
	  6 glxinfo:gl0              0.12     0.04
	  2 llvmpipe-0               0.08     0.05
	  2 llvmpipe-1               0.08     0.05
	  2 llvmpipe-10              0.08     0.05
	  2 llvmpipe-11              0.08     0.05
	  2 llvmpipe-12              0.08     0.05
	  2 llvmpipe-13              0.08     0.05
	  2 llvmpipe-14              0.08     0.05
	  2 llvmpipe-15              0.08     0.05
	  2 llvmpipe-2               0.08     0.05
	  2 llvmpipe-3               0.08     0.05
	  2 llvmpipe-4               0.08     0.05
	  2 llvmpipe-5               0.08     0.05
	  2 llvmpipe-6               0.08     0.05
	  2 llvmpipe-7               0.08     0.05
	  2 llvmpipe-8               0.08     0.05
	  2 llvmpipe-9               0.08     0.05
	  2 glxinfo                  0.06     0.02
	  2 glxinfo:cs0              0.06     0.02
	  2 glxinfo:disk$0           0.06     0.02
	  2 glxinfo:sh0              0.06     0.02
	  2 glxinfo:shlo0            0.06     0.02
	  6 clang                    0.05     0.07
	  3 rocminfo                 0.00     0.03
	  1 lspci                    0.00     0.02
	  1 ps                       0.00     0.01
	 83 sh                       0.00     0.00
	 13 gcc                      0.00     0.00
	 10 gsettings                0.00     0.00
	  9 stat                     0.00     0.00
	  8 systemd-detect-          0.00     0.00
	  6 llvm-link                0.00     0.00
	  5 phoronix-test-s          0.00     0.00
	  4 gmain                    0.00     0.00
	  2 cc                       0.00     0.00
	  2 dconf worker             0.00     0.00
	  2 lscpu                    0.00     0.00
	  2 uname                    0.00     0.00
	  2 which                    0.00     0.00
	  2 xset                     0.00     0.00
	  1 date                     0.00     0.00
	  1 dirname                  0.00     0.00
	  1 dmesg                    0.00     0.00
	  1 dmidecode                0.00     0.00
	  1 grep                     0.00     0.00
	  1 ifconfig                 0.00     0.00
	  1 ip                       0.00     0.00
	  1 lsmod                    0.00     0.00
	  1 mktemp                   0.00     0.00
	  1 qdbus                    0.00     0.00
	  1 readlink                 0.00     0.00
	  1 realpath                 0.00     0.00
	  1 sed                      0.00     0.00
	  1 sort                     0.00     0.00
	  1 stty                     0.00     0.00
	  1 systemctl                0.00     0.00
	  1 template.sh              0.00     0.00
	  1 wc                       0.00     0.00
	  1 xrandr                   0.00     0.00
0 processes running
47 maximum processes
Computation structures
      894708) dbench           cpu=2 start=5.76  finish=725.95
        894709) dbench           cpu=7 start=5.77  finish=725.95
          894710) dbench           cpu=14 start=5.77  finish=725.95
          894711) dbench           cpu=5 start=5.77  finish=725.95
          894712) dbench           cpu=1 start=5.77  finish=725.95
          894713) dbench           cpu=0 start=5.77  finish=725.95
          894714) dbench           cpu=15 start=5.77  finish=725.95
          894715) dbench           cpu=2 start=5.77  finish=725.95