
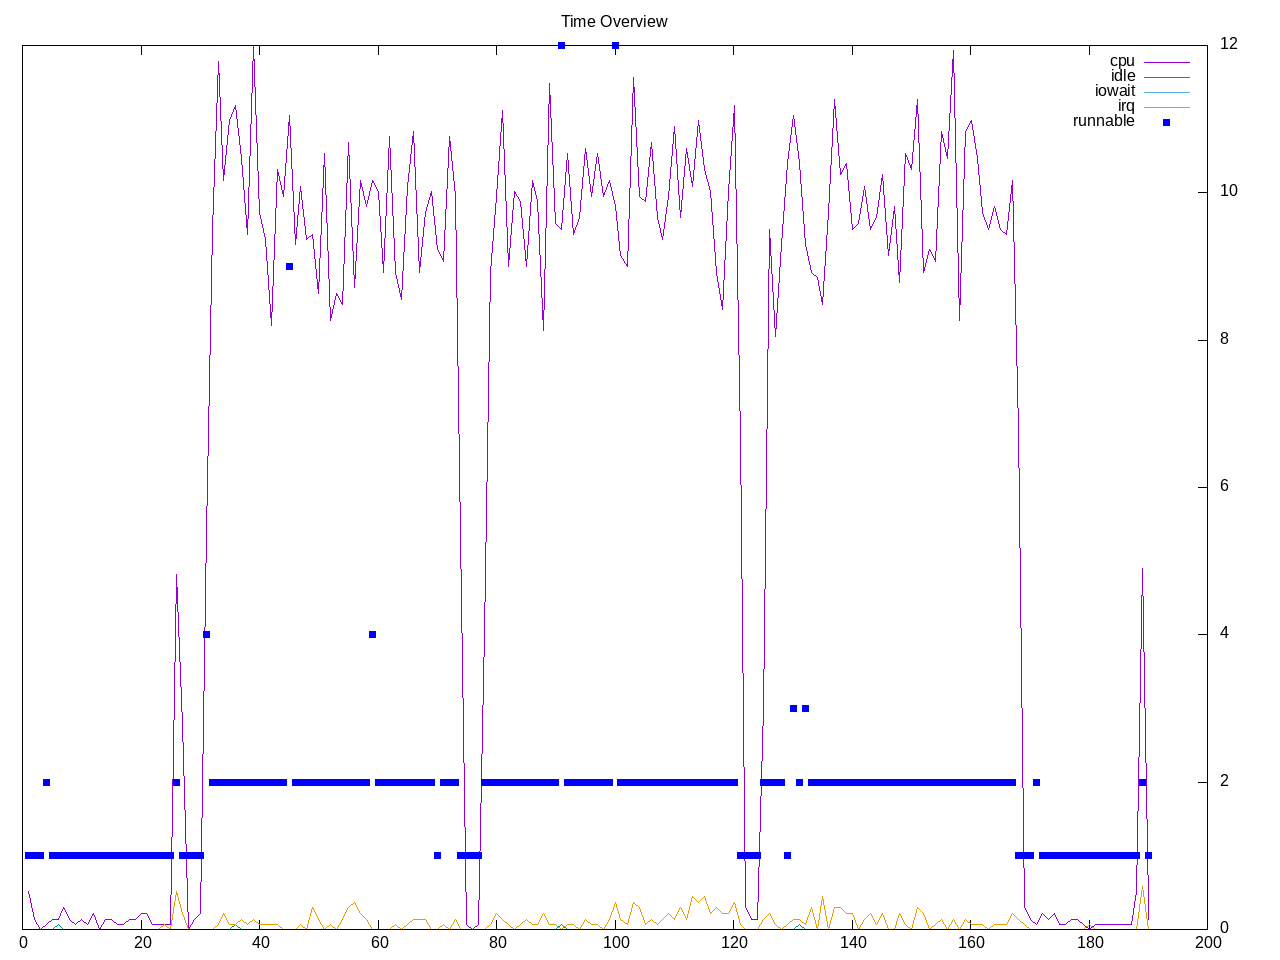
A speech to text process using Tensorflow to transcribe a three minute audio recording. One workload that runs in about a minute and then three times. Looks to be single-threaded
Topdown profile looks to be backend bound.
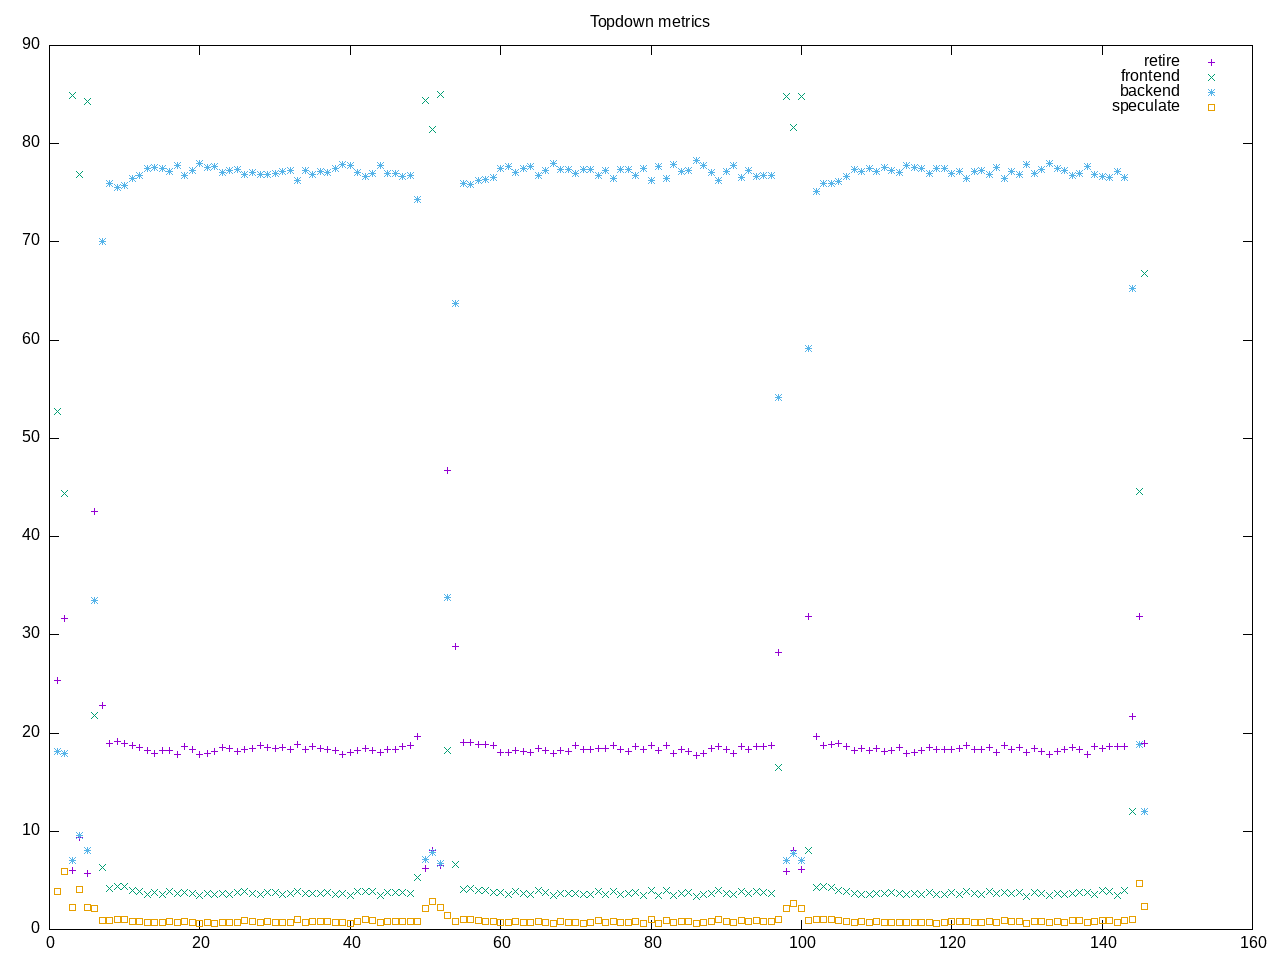
AMD metrics confirm a backend-stall heavy workload with low frontend stalls. There is not much floating point. A good amount of L2 access.
elapsed              160.615
on_cpu               0.070          # 1.12 / 16 cores
utime                169.116
stime                10.486
nvcsw                487526         # 99.62%
nivcsw               1847           # 0.38%
inblock              0              # 0.00/sec
onblock              12568          # 78.25/sec
cpu-clock            177998788938   # 177.999 seconds
task-clock           178430160190   # 178.430 seconds
page faults          235378         # 1319.160/sec
context switches     489985         # 2746.088/sec
cpu migrations       23465          # 131.508/sec
major page faults    3416           # 19.145/sec
minor page faults    231962         # 1300.016/sec
alignment faults     0              # 0.000/sec
emulation faults     0              # 0.000/sec
branches             49259821446    # 63.246 branches per 1000 inst
branch misses        521285591      # 1.06% branch miss
conditional          40408849370    # 51.882 conditional branches per 1000 inst
indirect             1381988941     # 1.774 indirect branches per 1000 inst
cpu-cycles           696267329926   # 0.24 GHz
instructions         772925724731   # 1.11 IPC
slots                1390055158284  #
retiring             256880226504   # 18.5% (18.7%)
-- ucode             151528830      #     0.0%
-- fastpath          256728697674   #    18.5%
frontend             58842049778    #  4.2% ( 4.3%) low
-- latency           47353735122    #     3.4%
-- bandwidth         11488314656    #     0.8%
backend              1047097332617  # 75.3% (76.2%) high
-- cpu               130578369248   #     9.4%
-- memory            916518963369   #    65.9%
speculation          11335440378    #  0.8% ( 0.8%) low
-- branch mispredict 10259441048    #     0.7%
-- pipeline restart  1075999330     #     0.1%
smt-contention       15848595211    #  1.1% ( 0.0%)
cpu-cycles           697932624106   # 0.28 GHz
instructions         777877029300   # 1.11 IPC
instructions         259176178766   # 172.445 l2 access per 1000 inst
l2 hit from l1       26157068658    # 31.31% l2 miss
l2 miss from l1      2105517564     #
l2 hit from l2 pf    6648857572     #
l3 hit from l2 pf    269934316      #
l3 miss from l2 pf   11617658376    #
instructions         259534288888   # 15.867 float per 1000 inst
float 512            65             # 0.000 AVX-512 per 1000 inst
float 256            2318481        # 0.009 AVX-256 per 1000 inst
float 128            4115648027     # 15.858 AVX-128 per 1000 inst
float MMX            0              # 0.000 MMX per 1000 inst
float scalar         4              # 0.000 scalar per 1000 inst
instructions         778907715084   #
opcache              94567228200    # 121.410 opcache per 1000 inst
opcache miss         4023676179     #  4.3% opcache miss rate
l1 dTLB miss         4315198834     # 5.540 L1 dTLB per 1000 inst
l2 dTLB miss         1044990269     # 1.342 L2 dTLB per 1000 inst
instructions         778450113458   #
icache               7298837934     # 9.376 icache per 1000 inst
icache miss          1369530995     # 18.8% icache miss rate
l1 iTLB miss         23755944       # 0.031 L1 iTLB per 1000 inst
l2 iTLB miss         0              # 0.000 L2 iTLB per 1000 inst
tlb flush            16742          # 0.000 TLB flush per 1000 inst
Intel metrics confirm both L3 and dram-bound natures of the memory-bound stalls.
elapsed              201.626
on_cpu               0.056          # 0.90 / 16 cores
utime                176.392
stime                5.582
nvcsw                468751         # 97.63%
nivcsw               11384          # 2.37%
inblock              1208           # 5.99/sec
onblock              1288           # 6.39/sec
cpu-clock            180258810774   # 180.259 seconds
task-clock           180510870708   # 180.511 seconds
page faults          222169         # 1230.779/sec
context switches     480881         # 2664.000/sec
cpu migrations       38123          # 211.195/sec
major page faults    2428           # 13.451/sec
minor page faults    219741         # 1217.328/sec
alignment faults     0              # 0.000/sec
emulation faults     0              # 0.000/sec
branches             49026825305    # 59.224 branches per 1000 inst
branch misses        354171008      # 0.72% branch miss
conditional          49026840985    # 59.224 conditional branches per 1000 inst
indirect             3105678778     # 3.752 indirect branches per 1000 inst
slots                3095032907966  #
retiring             773986641565   # 25.0% (25.0%)
-- ucode             10055304339    #     0.3%
-- fastpath          763931337226   #    24.7%
frontend             74881303981    #  2.4% ( 2.4%) low
-- latency           36919463368    #     1.2%
-- bandwidth         37961840613    #     1.2%
backend              2231130561294  # 72.1% (72.1%) high
-- cpu               1108840747474  #    35.8%
-- memory            1122289813820  #    36.3%
speculation          42072490016    #  1.4% ( 1.4%)
-- branch mispredict 39314118809    #     1.3%
-- pipeline restart  2758371207     #     0.1%
smt-contention       0              #  0.0% ( 0.0%)
cpu-cycles           618989502966   # 0.24 GHz
instructions         878893138266   # 1.42 IPC
l2 access            144912559758   # 188.820 l2 access per 1000 inst
l2 miss              98850887983    # 68.21% l2 miss
cpu-cycles           540075543736   # 42.5% memory latency
load stalls          228742926778   #  0.0% l1 bound
l1 miss              463786101064   # 47.1% l2 bound
l2 miss              209158694764   # 14.2% l3 bound
l3 miss              132645464628   # 24.6% dram bound
store_stalls         624046835      #  0.1% store bound
Process profile shows time spent on the deepspeech process.
450 processes
	102 deepspeech            5788.84   199.24
	 68 clinfo                  16.53     6.33
	 38 vulkaninfo               1.34     0.96
	  4 vulkani:disk$0           0.15     0.11
	  6 glxinfo:gdrv0            0.09     0.09
	  6 glxinfo:gl0              0.09     0.09
	  2 llvmpipe-0               0.07     0.05
	  2 llvmpipe-1               0.07     0.05
	  2 llvmpipe-10              0.07     0.05
	  2 llvmpipe-11              0.07     0.05
	  2 llvmpipe-12              0.07     0.05
	  2 llvmpipe-13              0.07     0.05
	  2 llvmpipe-14              0.07     0.05
	  2 llvmpipe-15              0.07     0.05
	  2 llvmpipe-2               0.07     0.05
	  2 llvmpipe-3               0.07     0.05
	  2 llvmpipe-4               0.07     0.05
	  2 llvmpipe-5               0.07     0.05
	  2 llvmpipe-6               0.07     0.05
	  2 llvmpipe-7               0.07     0.05
	  2 llvmpipe-8               0.07     0.05
	  2 llvmpipe-9               0.07     0.05
	  6 php                      0.06     0.09
	  2 glxinfo                  0.06     0.03
	  6 clang                    0.05     0.07
	  2 glxinfo:cs0              0.05     0.03
	  2 glxinfo:disk$0           0.05     0.03
	  2 glxinfo:sh0              0.05     0.03
	  2 glxinfo:shlo0            0.05     0.03
	  3 rocminfo                 0.00     0.03
	  1 lspci                    0.00     0.02
	 81 sh                       0.00     0.00
	 12 gcc                      0.00     0.00
	  9 gsettings                0.00     0.00
	  8 stat                     0.00     0.00
	  8 systemd-detect-          0.00     0.00
	  6 llvm-link                0.00     0.00
	  5 gmain                    0.00     0.00
	  5 phoronix-test-s          0.00     0.00
	  3 deepspeech-run           0.00     0.00
	  2 dconf worker             0.00     0.00
	  2 lscpu                    0.00     0.00
	  2 uname                    0.00     0.00
	  2 which                    0.00     0.00
	  2 xset                     0.00     0.00
	  1 cc                       0.00     0.00
	  1 date                     0.00     0.00
	  1 dirname                  0.00     0.00
	  1 dmesg                    0.00     0.00
	  1 dmidecode                0.00     0.00
	  1 grep                     0.00     0.00
	  1 ifconfig                 0.00     0.00
	  1 ip                       0.00     0.00
	  1 lsmod                    0.00     0.00
	  1 mktemp                   0.00     0.00
	  1 ps                       0.00     0.00
	  1 qdbus                    0.00     0.00
	  1 readlink                 0.00     0.00
	  1 realpath                 0.00     0.00
	  1 sed                      0.00     0.00
	  1 sort                     0.00     0.00
	  1 stty                     0.00     0.00
	  1 systemctl                0.00     0.00
	  1 template.sh              0.00     0.00
	  1 wc                       0.00     0.00
	  1 xrandr                   0.00     0.00
0 processes running
47 maximum processes
Computation blocks
      906663) deepspeech-run   cpu=5 start=5.99  finish=49.12
        906664) deepspeech       cpu=5 start=6.00  finish=49.11
          906665) deepspeech       cpu=4 start=6.01  finish=49.11
          906666) deepspeech       cpu=14 start=6.01  finish=49.11
          906667) deepspeech       cpu=13 start=6.01  finish=49.11
          906668) deepspeech       cpu=2 start=6.01  finish=49.11
          906669) deepspeech       cpu=9 start=6.01  finish=49.11
          906670) deepspeech       cpu=7 start=6.01  finish=49.11
          906671) deepspeech       cpu=1 start=6.01  finish=49.11
          906672) deepspeech       cpu=8 start=6.01  finish=49.11
          906673) deepspeech       cpu=12 start=6.01  finish=49.11
          906674) deepspeech       cpu=8 start=6.01  finish=49.11
          906675) deepspeech       cpu=15 start=6.01  finish=49.11
          906676) deepspeech       cpu=6 start=6.01  finish=49.11
          906677) deepspeech       cpu=10 start=6.01  finish=49.11
          906678) deepspeech       cpu=3 start=6.01  finish=49.11
          906679) deepspeech       cpu=9 start=6.01  finish=49.11
          906680) deepspeech       cpu=11 start=6.01  finish=49.11
          906681) deepspeech       cpu=7 start=6.01  finish=49.11
          906682) deepspeech       cpu=11 start=6.01  finish=49.11
          906683) deepspeech       cpu=0 start=6.01  finish=49.11
          906684) deepspeech       cpu=14 start=6.01  finish=49.11
          906685) deepspeech       cpu=6 start=6.01  finish=49.11
          906686) deepspeech       cpu=13 start=6.01  finish=49.11
          906687) deepspeech       cpu=4 start=6.01  finish=49.11
          906688) deepspeech       cpu=12 start=6.01  finish=49.11
          906689) deepspeech       cpu=13 start=6.01  finish=49.11
          906690) deepspeech       cpu=15 start=6.01  finish=49.11
          906691) deepspeech       cpu=5 start=6.01  finish=49.11
          906692) deepspeech       cpu=10 start=6.01  finish=49.11
          906693) deepspeech       cpu=1 start=6.01  finish=49.11
          906694) deepspeech       cpu=2 start=6.01  finish=49.11
          906695) deepspeech       cpu=0 start=6.01  finish=49.11
          906696) deepspeech       cpu=3 start=6.01  finish=49.11
          906697) deepspeech       cpu=11 start=6.01  finish=49.11