
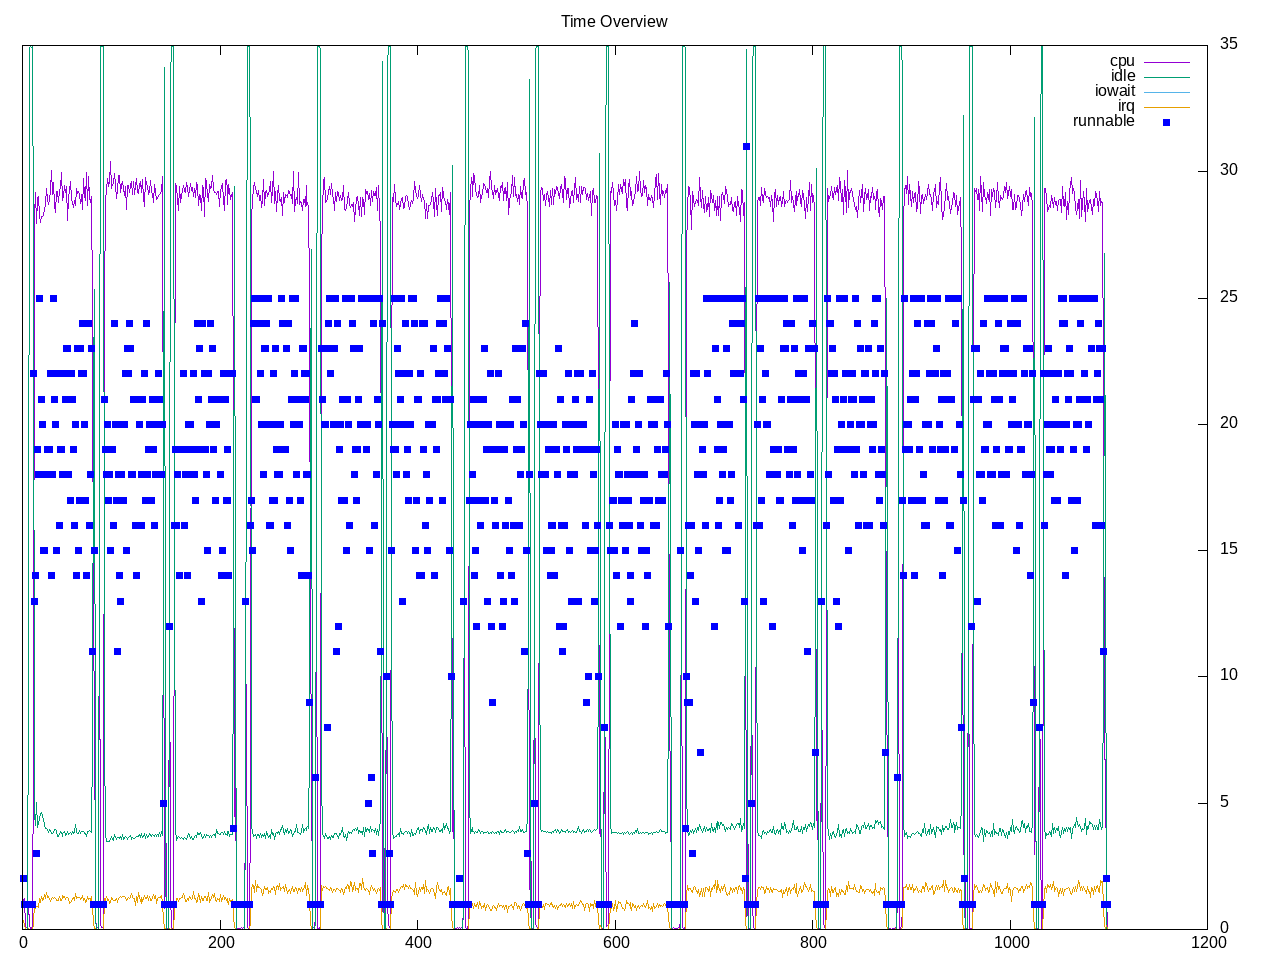
An Open Source database server that is a redis replacement as a memory store. The test has many configurations and I picked one with 20 clients and five different ratios of read/writes. This appears to hang on my Intel system with no obvious causes (other than a lot of wifi interface issues in syslog.) Profile shows a lot of I/O wait as well as interrupts.
Topdown profile shows backend stalls and frontend stalls at roughly similar ratios with a 20% retirement rate.
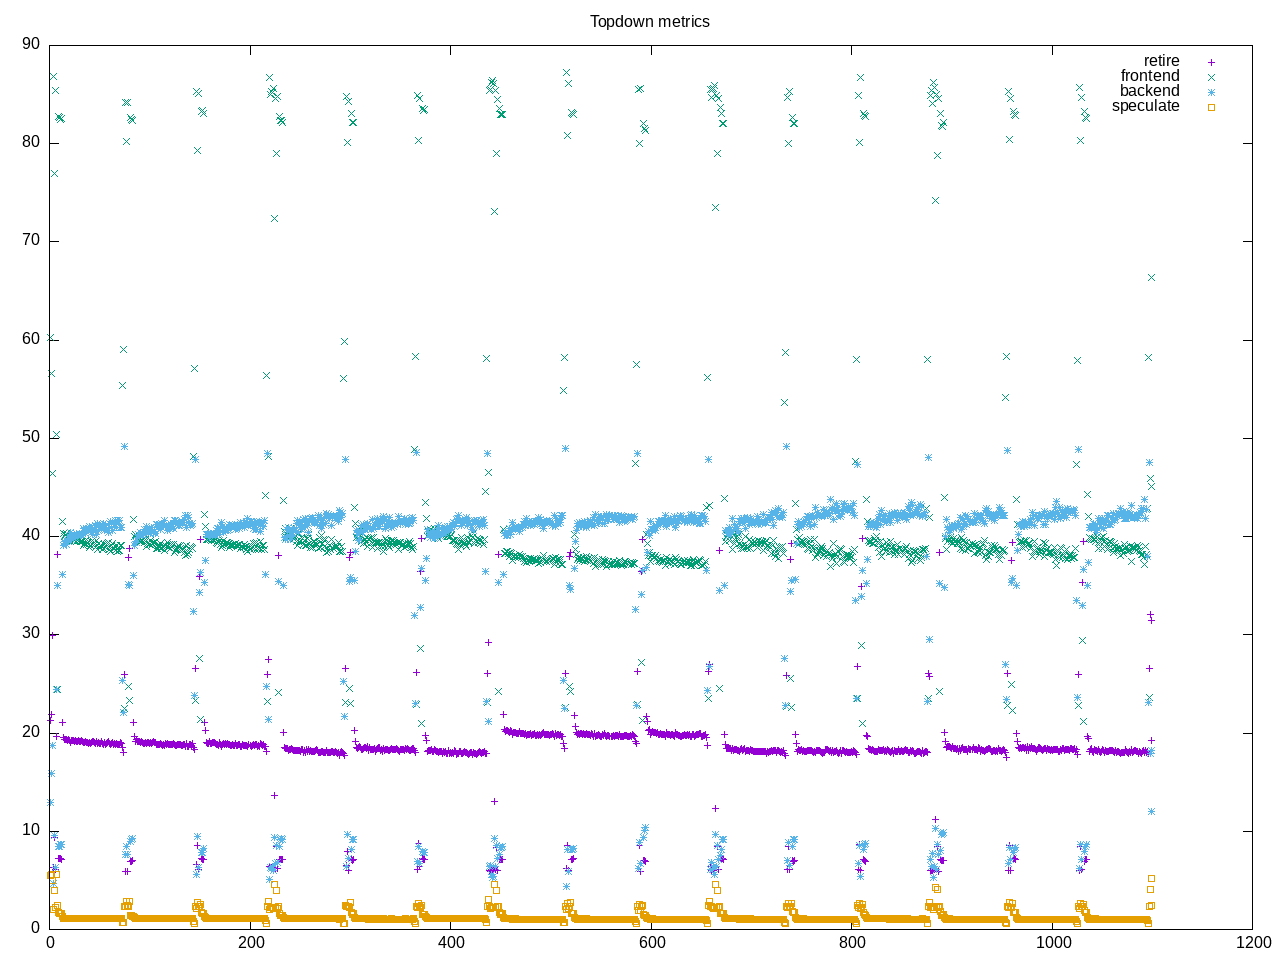
AMD metrics show only ~3 cores used, not much floating point
elapsed              1098.123
on_cpu               0.182          # 2.91 / 16 cores
utime                2136.912
stime                1056.417
nvcsw                23918122       # 99.61%
nivcsw               94534          # 0.39%
inblock              0              # 0.00/sec
onblock              15088          # 13.74/sec
cpu-clock            12971200485365 # 12971.200 seconds
task-clock           13008167174499 # 13008.167 seconds
page faults          4074913        # 313.258/sec
context switches     149665213      # 11505.480/sec
cpu migrations       8975598        # 689.997/sec
major page faults    16             # 0.001/sec
minor page faults    4074897        # 313.257/sec
alignment faults     0              # 0.000/sec
emulation faults     0              # 0.000/sec
branches             8265555923655  # 187.034 branches per 1000 inst
branch misses        236662896331   # 2.86% branch miss
conditional          5119621260643  # 115.847 conditional branches per 1000 inst
indirect             371703877169   # 8.411 indirect branches per 1000 inst
cpu-cycles           80814807480846 # 2.90 GHz
instructions         71114853287286 # 0.88 IPC
slots                160582787387796 #
retiring             24859185583438 # 15.5% (18.4%)
-- ucode             138605826243   #     0.1%
-- fastpath          24720579757195 #    15.4%
frontend             52746936524890 # 32.8% (39.1%)
-- latency           40968756310632 #    25.5%
-- bandwidth         11778180214258 #     7.3%
backend              55894112008895 # 34.8% (41.4%)
-- cpu               5920834715390  #     3.7%
-- memory            49973277293505 #    31.1%
speculation          1436696800352  #  0.9% ( 1.1%)
-- branch mispredict 1406021540212  #     0.9%
-- pipeline restart  30675260140    #     0.0%
smt-contention       25617933291494 # 16.0% ( 0.0%)
cpu-cycles           50316928921807 # 2.86 GHz
instructions         45061442490839 # 0.90 IPC
instructions         14890437861435 # 57.239 l2 access per 1000 inst
l2 hit from l1       727184075817   # 22.78% l2 miss
l2 miss from l1      139402165452   #
l2 hit from l2 pf    70337131879    #
l3 hit from l2 pf    43389273473    #
l3 miss from l2 pf   11397328796    #
instructions         14898190265910 # 21.401 float per 1000 inst
float 512            96             # 0.000 AVX-512 per 1000 inst
float 256            658            # 0.000 AVX-256 per 1000 inst
float 128            318843327322   # 21.401 AVX-128 per 1000 inst
float MMX            0              # 0.000 MMX per 1000 inst
float scalar         1              # 0.000 scalar per 1000 inst
instructions         45078808461884 #
opcache              9034904210347  # 200.425 opcache per 1000 inst
opcache miss         2900738764571  # 32.1% opcache miss rate
l1 dTLB miss         306619447606   # 6.802 L1 dTLB per 1000 inst
l2 dTLB miss         46943276980    # 1.041 L2 dTLB per 1000 inst
instructions         44954439840462 #
icache               3852925593490  # 85.707 icache per 1000 inst
icache miss          1237410413656  # 32.1% icache miss rate
l1 iTLB miss         233059462625   # 5.184 L1 iTLB per 1000 inst
l2 iTLB miss         0              # 0.000 L2 iTLB per 1000 inst
tlb flush            40017580       # 0.001 TLB flush per 1000 inst
Process profile
776 processes
	135 memtier_benchma      19406.53  9111.62
	 15 dragonfly             7708.29  2030.69
	 15 Proactor2             7708.29  2030.68
	 15 Proactor5             7708.29  2030.64
	 15 Proactor4             7708.28  2030.67
	 15 Proactor7             7708.28  2030.67
	 15 Proactor3             7708.28  2030.66
	 15 Proactor0             7708.28  2030.64
	 15 Proactor6             7708.27  2030.66
	 15 Proactor1             7708.27  2030.65
	 15 Proactor14            7708.26  2030.64
	 15 Proactor10            7708.25  2030.65
	 15 Proactor12            7708.24  2030.64
	 15 Proactor8             7708.23  2030.65
	 15 Proactor9             7708.23  2030.64
	 15 Proactor11            7708.23  2030.63
	 15 Proactor13            7708.23  2030.62
	 15 Proactor15            7708.23  2030.61
	 68 clinfo                  20.01     5.68
	 38 vulkaninfo               1.67     0.95
	  4 vulkani:disk$0           0.17     0.10
	  6 php                      0.11     0.21
	  6 glxinfo:gdrv0            0.10     0.10
	  6 glxinfo:gl0              0.10     0.10
	  2 llvmpipe-0               0.09     0.05
	  2 llvmpipe-1               0.09     0.05
	  2 llvmpipe-10              0.09     0.05
	  2 llvmpipe-11              0.09     0.05
	  2 llvmpipe-12              0.09     0.05
	  2 llvmpipe-13              0.09     0.05
	  2 llvmpipe-14              0.09     0.05
	  2 llvmpipe-15              0.09     0.05
	  2 llvmpipe-2               0.09     0.05
	  2 llvmpipe-3               0.09     0.05
	  2 llvmpipe-4               0.09     0.05
	  2 llvmpipe-5               0.09     0.05
	  2 llvmpipe-6               0.09     0.05
	  2 llvmpipe-7               0.09     0.05
	  2 llvmpipe-8               0.09     0.05
	  2 llvmpipe-9               0.09     0.05
	  6 clang                    0.06     0.06
	  2 glxinfo                  0.06     0.04
	  2 glxinfo:cs0              0.06     0.04
	  2 glxinfo:disk$0           0.06     0.04
	  2 glxinfo:sh0              0.06     0.04
	  2 glxinfo:shlo0            0.06     0.04
	  3 rocminfo                 0.03     0.00
	  1 lspci                    0.00     0.03
	  1 ps                       0.00     0.01
	 90 sh                       0.00     0.00
	 15 dragonflydb              0.00     0.00
	 15 sleep                    0.00     0.00
	 13 gcc                      0.00     0.00
	  9 gsettings                0.00     0.00
	  8 stat                     0.00     0.00
	  8 systemd-detect-          0.00     0.00
	  6 llvm-link                0.00     0.00
	  5 gmain                    0.00     0.00
	  5 phoronix-test-s          0.00     0.00
	  2 cc                       0.00     0.00
	  2 dconf worker             0.00     0.00
	  2 lscpu                    0.00     0.00
	  2 uname                    0.00     0.00
	  2 which                    0.00     0.00
	  2 xset                     0.00     0.00
	  1 date                     0.00     0.00
	  1 dirname                  0.00     0.00
	  1 dmesg                    0.00     0.00
	  1 dmidecode                0.00     0.00
	  1 grep                     0.00     0.00
	  1 ifconfig                 0.00     0.00
	  1 ip                       0.00     0.00
	  1 lsmod                    0.00     0.00
	  1 mktemp                   0.00     0.00
	  1 qdbus                    0.00     0.00
	  1 readlink                 0.00     0.00
	  1 realpath                 0.00     0.00
	  1 sed                      0.00     0.00
	  1 sort                     0.00     0.00
	  1 stty                     0.00     0.00
	  1 systemctl                0.00     0.00
	  1 template.sh              0.00     0.00
	  1 wc                       0.00     0.00
	  1 xrandr                   0.00     0.00
0 processes running
47 maximum processes
Computation block looks as follows
      924844) dragonflydb      cpu=13 start=7.20  finish=74.24
        924845) dragonfly        cpu=2 start=7.20  finish=74.47
          924847) Proactor0        cpu=0 start=7.21  finish=74.47
          924848) Proactor1        cpu=1 start=7.21  finish=74.47
          924849) Proactor2        cpu=2 start=7.21  finish=74.47
          924850) Proactor3        cpu=3 start=7.21  finish=74.47
          924851) Proactor4        cpu=4 start=7.21  finish=74.47
          924852) Proactor5        cpu=5 start=7.21  finish=74.47
          924853) Proactor6        cpu=6 start=7.21  finish=74.47
          924854) Proactor7        cpu=7 start=7.21  finish=74.47
          924855) Proactor8        cpu=8 start=7.21  finish=74.47
          924856) Proactor9        cpu=9 start=7.21  finish=74.47
          924857) Proactor10       cpu=10 start=7.21  finish=74.47
          924858) Proactor11       cpu=11 start=7.21  finish=74.47
          924859) Proactor12       cpu=12 start=7.21  finish=74.47
          924860) Proactor13       cpu=13 start=7.21  finish=74.47
          924861) Proactor14       cpu=14 start=7.21  finish=74.47
          924862) Proactor15       cpu=15 start=7.21  finish=74.47
        924846) sleep            cpu=11 start=7.20  finish=12.20
        924863) memtier_benchma  cpu=4 start=12.21 finish=74.24
          924864) memtier_benchma  cpu=3 start=12.22 finish=72.28
          924865) memtier_benchma  cpu=10 start=12.22 finish=72.28
          924866) memtier_benchma  cpu=0 start=12.22 finish=72.28
          924867) memtier_benchma  cpu=12 start=12.22 finish=72.28
          924868) memtier_benchma  cpu=5 start=12.22 finish=72.28
          924869) memtier_benchma  cpu=14 start=12.22 finish=72.28
          924870) memtier_benchma  cpu=2 start=12.22 finish=72.27
          924871) memtier_benchma  cpu=11 start=12.22 finish=73.29