
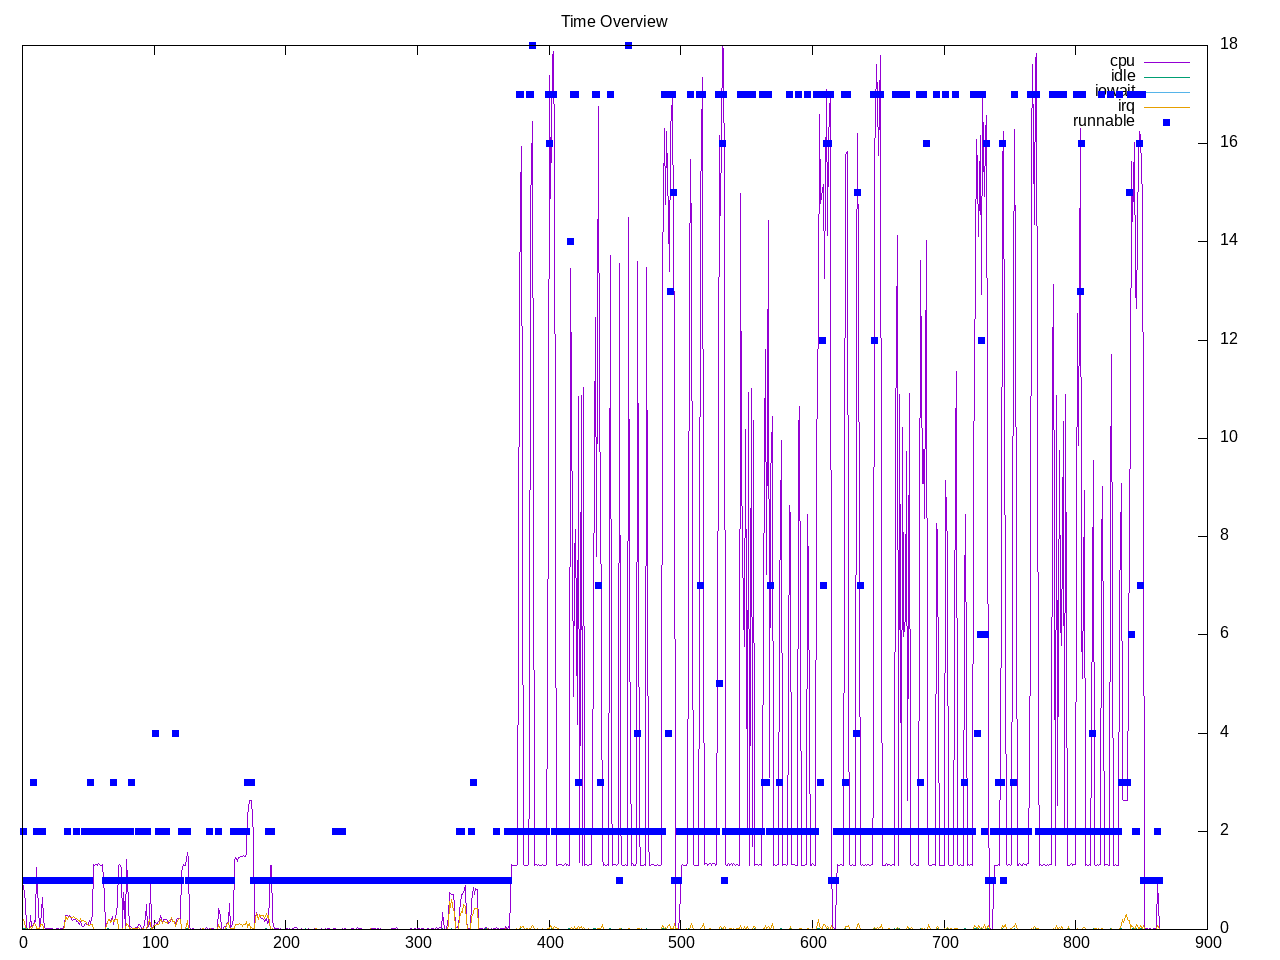
An in-progress SQL OLAP database. There are two workloads, though the first one seems very abbreviated on my AMD run and not on the Intel run. The systemtime below also suggests this quick abort didn’t happen. Instead the first run looks single-threaded and the second runs a mix of single-threaded and once per core.
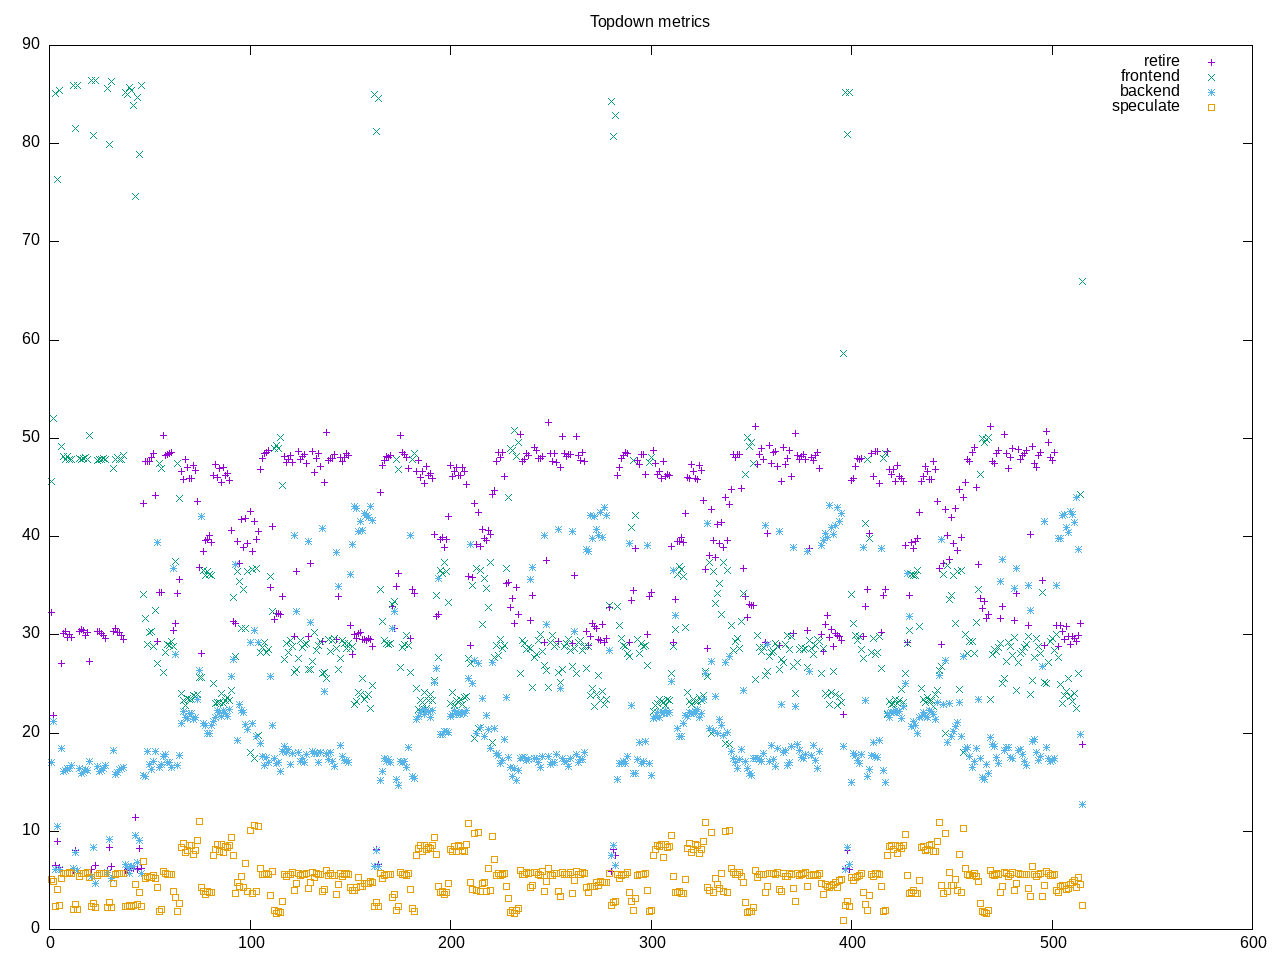
Topdown metrics with the timescales not matching the previous graph, also suggests this one could have quit the first workload early and mostly looking at the second workload where the retirement reaches highest point but also a blurring with frontend and backend stalls.
AMD metrics also show a shorter runtime so expect mostly the second workload. This has ~1/5 instructions are branches and less than 1/4 of the cores kept busy. A relatively low floating point.
elapsed              547.152
on_cpu               0.229          # 3.67 / 16 cores
utime                1829.973
stime                175.594
nvcsw                724734         # 95.49%
nivcsw               34194          # 4.51%
inblock              104            # 0.19/sec
onblock              66306048       # 121184.06/sec
cpu-clock            2006098320016  # 2006.098 seconds
task-clock           2006459295662  # 2006.459 seconds
page faults          43860238       # 21859.520/sec
context switches     761385         # 379.467/sec
cpu migrations       11771          # 5.867/sec
major page faults    2              # 0.001/sec
minor page faults    43860236       # 21859.519/sec
alignment faults     0              # 0.000/sec
emulation faults     0              # 0.000/sec
branches             2989521993930  # 209.081 branches per 1000 inst
branch misses        44666476992    # 1.49% branch miss
conditional          1855246304543  # 129.752 conditional branches per 1000 inst
indirect             336448903110   # 23.531 indirect branches per 1000 inst
cpu-cycles           8205492318167  # 0.99 GHz
instructions         14167935669400 # 1.73 IPC
slots                16457577130686 #
retiring             4848133219219  # 29.5% (36.1%)
-- ucode             12640610594    #     0.1%
-- fastpath          4835492608625  #    29.4%
frontend             4321707575747  # 26.3% (32.2%)
-- latency           2363442872946  #    14.4%
-- bandwidth         1958264702801  #    11.9%
backend              3675392035681  # 22.3% (27.4%)
-- cpu               521630866054   #     3.2%
-- memory            3153761169627  #    19.2%
speculation          580918774688   #  3.5% ( 4.3%)
-- branch mispredict 574059476463   #     3.5%
-- pipeline restart  6859298225     #     0.0%
smt-contention       3031336112693  # 18.4% ( 0.0%)
cpu-cycles           8220556664269  # 0.99 GHz
instructions         14166689794245 # 1.72 IPC
instructions         4726827381322  # 11.842 l2 access per 1000 inst
l2 hit from l1       36650616240    # 28.10% l2 miss
l2 miss from l1      5214331727     #
l2 hit from l2 pf    8812526969     #
l3 hit from l2 pf    3719577488     #
l3 miss from l2 pf   6793561232     #
instructions         4722831156232  # 20.931 float per 1000 inst
float 512            72             # 0.000 AVX-512 per 1000 inst
float 256            642            # 0.000 AVX-256 per 1000 inst
float 128            98853835720    # 20.931 AVX-128 per 1000 inst
float MMX            0              # 0.000 MMX per 1000 inst
float scalar         0              # 0.000 scalar per 1000 inst
Intel metrics
elapsed              1826.836
on_cpu               0.282          # 4.51 / 16 cores
utime                7881.944
stime                364.632
nvcsw                2932996        # 94.39%
nivcsw               174235         # 5.61%
inblock              276128         # 151.15/sec
onblock              70939448       # 38831.86/sec
cpu-clock            8239226921074  # 8239.227 seconds
task-clock           8240397739741  # 8240.398 seconds
page faults          116908038      # 14187.184/sec
context switches     3116153        # 378.156/sec
cpu migrations       121550         # 14.751/sec
major page faults    1481           # 0.180/sec
minor page faults    116906557      # 14187.004/sec
alignment faults     0              # 0.000/sec
emulation faults     0              # 0.000/sec
branches             8685405904523  # 190.950 branches per 1000 inst
branch misses        129488118910   # 1.49% branch miss
conditional          8685406471659  # 190.950 conditional branches per 1000 inst
indirect             2611251130674  # 57.409 indirect branches per 1000 inst
slots                56189409146582 #
retiring             27383968130937 # 48.7% (48.7%)
-- ucode             2029604665216  #     3.6%
-- fastpath          25354363465721 #    45.1%
frontend             10622806556285 # 18.9% (18.9%)
-- latency           4873119794808  #     8.7%
-- bandwidth         5749686761477  #    10.2%
backend              11019320981325 # 19.6% (19.6%)
-- cpu               4663030301016  #     8.3%
-- memory            6356290680309  #    11.3%
speculation          7380984669753  # 13.1% (13.1%)
-- branch mispredict 7196351812556  #    12.8%
-- pipeline restart  184632857197   #     0.3%
smt-contention       0              #  0.0% ( 0.0%)
cpu-cycles           27125366791737 # 1.41 GHz
instructions         50101367608730 # 1.85 IPC
l2 access            634116960124   # 22.630 l2 access per 1000 inst
l2 miss              173861651765   # 27.42% l2 miss
Process overview shows many benchmark runner processes spending almost all the time.
15898 processes
	15540 benchmark_runne      301174.39 33694.99
	 68 clinfo                  16.21     6.98
	 38 vulkaninfo               0.57     1.71
	  6 glxinfo:gdrv0            0.16     0.03
	  6 glxinfo:gl0              0.16     0.03
	  2 glxinfo                  0.08     0.01
	  2 glxinfo:cs0              0.08     0.01
	  2 glxinfo:disk$0           0.08     0.01
	  2 glxinfo:sh0              0.08     0.01
	  2 glxinfo:shlo0            0.08     0.01
	  6 clang                    0.07     0.05
	  4 vulkani:disk$0           0.06     0.18
	  6 php                      0.04     0.16
	  2 llvmpipe-0               0.03     0.09
	  2 llvmpipe-1               0.03     0.09
	  2 llvmpipe-10              0.03     0.09
	  2 llvmpipe-11              0.03     0.09
	  2 llvmpipe-12              0.03     0.09
	  2 llvmpipe-13              0.03     0.09
	  2 llvmpipe-14              0.03     0.09
	  2 llvmpipe-15              0.03     0.09
	  2 llvmpipe-2               0.03     0.09
	  2 llvmpipe-3               0.03     0.09
	  2 llvmpipe-4               0.03     0.09
	  2 llvmpipe-5               0.03     0.09
	  2 llvmpipe-6               0.03     0.09
	  2 llvmpipe-7               0.03     0.09
	  2 llvmpipe-8               0.03     0.09
	  2 llvmpipe-9               0.03     0.09
	  3 rocminfo                 0.03     0.00
	  1 lspci                    0.00     0.02
	  1 ps                       0.00     0.01
	 84 sh                       0.00     0.00
	 13 gcc                      0.00     0.00
	  9 gsettings                0.00     0.00
	  8 duckdb                   0.00     0.00
	  8 stat                     0.00     0.00
	  8 systemd-detect-          0.00     0.00
	  6 llvm-link                0.00     0.00
	  5 gmain                    0.00     0.00
	  5 phoronix-test-s          0.00     0.00
	  2 cc                       0.00     0.00
	  2 dconf worker             0.00     0.00
	  2 lscpu                    0.00     0.00
	  2 uname                    0.00     0.00
	  2 which                    0.00     0.00
	  2 xset                     0.00     0.00
	  1 date                     0.00     0.00
	  1 dirname                  0.00     0.00
	  1 dmesg                    0.00     0.00
	  1 dmidecode                0.00     0.00
	  1 grep                     0.00     0.00
	  1 ifconfig                 0.00     0.00
	  1 ip                       0.00     0.00
	  1 lsmod                    0.00     0.00
	  1 mktemp                   0.00     0.00
	  1 qdbus                    0.00     0.00
	  1 readlink                 0.00     0.00
	  1 realpath                 0.00     0.00
	  1 sed                      0.00     0.00
	  1 sort                     0.00     0.00
	  1 stty                     0.00     0.00
	  1 systemctl                0.00     0.00
	  1 template.sh              0.00     0.00
	  1 wc                       0.00     0.00
	  1 xrandr                   0.00     0.00
0 processes running
47 maximum processes