
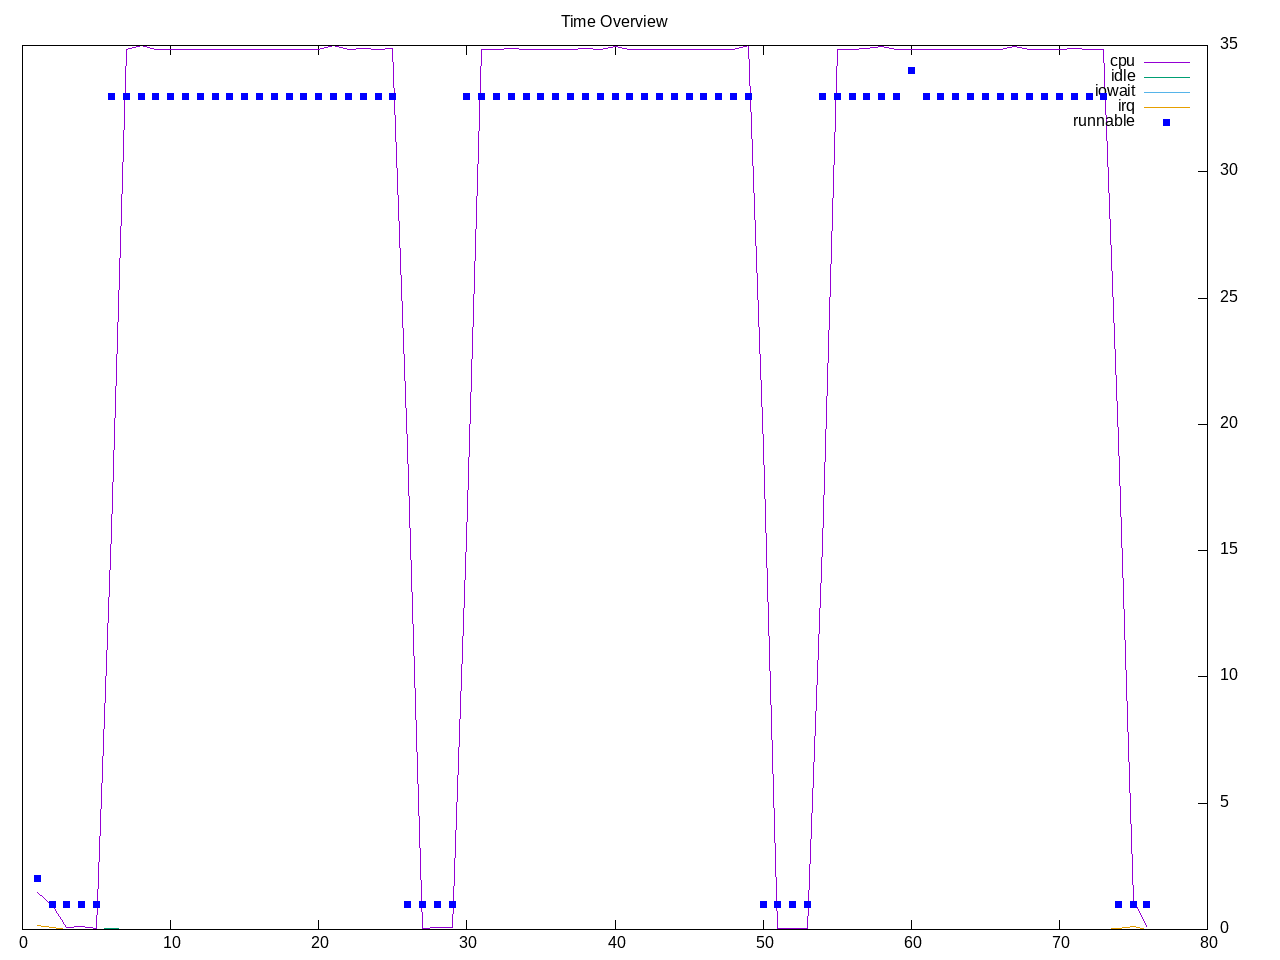
A test that generates workloads resembling web server workloads. Quick running but many threads.
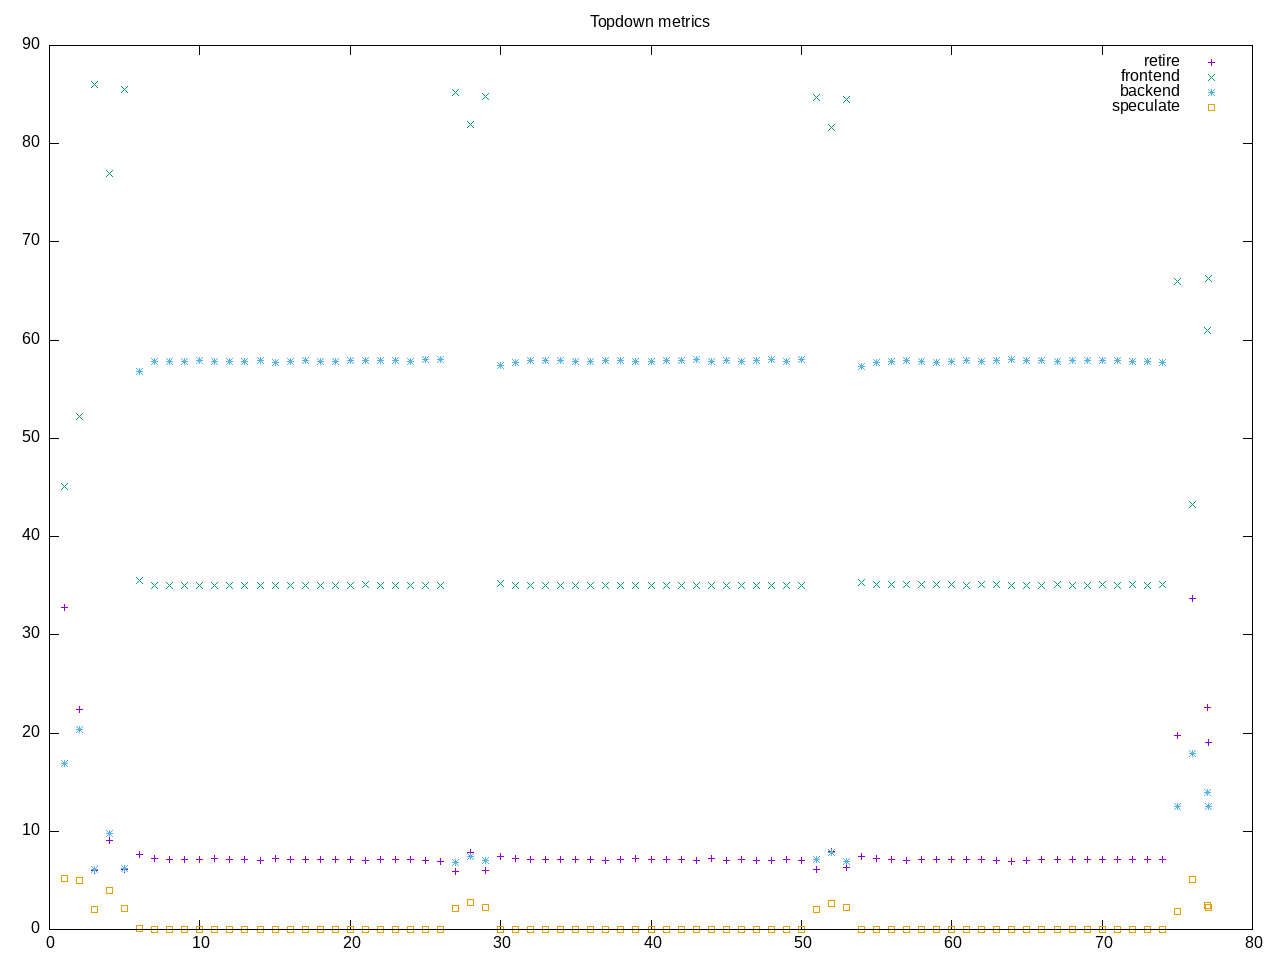
Topdown profile shows higher levels of both backend stalls and frontend stalls.
AMD metrics show a large amount of L2 access? Not much floating point and a high opcache miss rate.
elapsed              76.014
on_cpu               0.790          # 12.64 / 16 cores
utime                960.128
stime                0.969
nvcsw                2441           # 3.57%
nivcsw               65967          # 96.43%
inblock              0              # 0.00/sec
onblock              12568          # 165.34/sec
cpu-clock            961212794580   # 961.213 seconds
task-clock           961219693426   # 961.220 seconds
page faults          174119         # 181.144/sec
context switches     68613          # 71.381/sec
cpu migrations       794            # 0.826/sec
major page faults    43             # 0.045/sec
minor page faults    174076         # 181.099/sec
alignment faults     0              # 0.000/sec
emulation faults     0              # 0.000/sec
branches             8490158192     # 233.934 branches per 1000 inst
branch misses        122343044      # 1.44% branch miss
conditional          6245003590     # 172.072 conditional branches per 1000 inst
indirect             174774988      # 4.816 indirect branches per 1000 inst
cpu-cycles           3619643263703  # 2.97 GHz
instructions         36257254806    # 0.01 IPC low
slots                7241048093232  #
retiring             481361243242   #  6.6% ( 7.1%) low
-- ucode             56944409       #     0.0%
-- fastpath          481304298833   #     6.6%
frontend             2366660898335  # 32.7% (35.1%)
-- latency           70688934948    #     1.0%
-- bandwidth         2295971963387  #    31.7%
backend              3883706267866  # 53.6% (57.7%)
-- cpu               149362501021   #     2.1%
-- memory            3734343766845  #    51.6%
speculation          2804700251     #  0.0% ( 0.0%) low
-- branch mispredict 2049764610     #     0.0%
-- pipeline restart  754935641      #     0.0%
smt-contention       506509742595   #  7.0% ( 0.0%)
cpu-cycles           3614193928091  # 2.96 GHz
instructions         36147971263    # 0.01 IPC low
instructions         11965344127    # 42861.333 l2 access per 1000 inst
l2 hit from l1       228293533402   # 26.95% l2 miss
l2 miss from l1      20386259467    #
l2 hit from l2 pf    166706468197   #
l3 hit from l2 pf    117806766518   #
l3 miss from l2 pf   43833622       #
instructions         12235477579    # 18.695 float per 1000 inst
float 512            66             # 0.000 AVX-512 per 1000 inst
float 256            596            # 0.000 AVX-256 per 1000 inst
float 128            228741691      # 18.695 AVX-128 per 1000 inst
float MMX            0              # 0.000 MMX per 1000 inst
float scalar         0              # 0.000 scalar per 1000 inst
instructions         36020965289    #
opcache              9790344647     # 271.796 opcache per 1000 inst
opcache miss         4930331972     # 50.4% opcache miss rate
l1 dTLB miss         11689841338    # 324.529 L1 dTLB per 1000 inst
l2 dTLB miss         26979105       # 0.749 L2 dTLB per 1000 inst
instructions         36020505704    #
icache               6350080470     # 176.291 icache per 1000 inst
icache miss          2161166540     # 34.0% icache miss rate
l1 iTLB miss         9196328        # 0.255 L1 iTLB per 1000 inst
l2 iTLB miss         0              # 0.000 L2 iTLB per 1000 inst
tlb flush            19035          # 0.001 TLB flush per 1000 inst
Intel metrics also show a high amount of L2 access and a very large amount of backend memory stalls.
elapsed              76.197
on_cpu               0.788          # 12.61 / 16 cores
utime                960.003
stime                0.625
nvcsw                2219           # 3.37%
nivcsw               63631          # 96.63%
inblock              2216           # 29.08/sec
onblock              1320           # 17.32/sec
cpu-clock            960779969649   # 960.780 seconds
task-clock           960785636136   # 960.786 seconds
page faults          162859         # 169.506/sec
context switches     66055          # 68.751/sec
cpu migrations       855            # 0.890/sec
major page faults    24             # 0.025/sec
minor page faults    162835         # 169.481/sec
alignment faults     0              # 0.000/sec
emulation faults     0              # 0.000/sec
branches             5326251888     # 224.184 branches per 1000 inst
branch misses        21464693       # 0.40% branch miss
conditional          5326266800     # 224.185 conditional branches per 1000 inst
indirect             656377561      # 27.627 indirect branches per 1000 inst
slots                5160889464836  #
retiring             291731107053   #  5.7% ( 5.7%) low
-- ucode             100764509180   #     2.0%
-- fastpath          190966597873   #     3.7%
frontend             346184570707   #  6.7% ( 6.7%)
-- latency           337244658529   #     6.5%
-- bandwidth         8939912178     #     0.2%
backend              4521787284195  # 87.6% (87.6%) high
-- cpu               572017397254   #    11.1%
-- memory            3949769886941  #    76.5%
speculation          3292312798     #  0.1% ( 0.1%) low
-- branch mispredict 3103520615     #     0.1%
-- pipeline restart  188792183      #     0.0%
smt-contention       0              #  0.0% ( 0.0%)
cpu-cycles           3597502784460  # 1.82 GHz
instructions         32690767154    # 0.01 IPC low
l2 access            547037131507   # 21244.104 l2 access per 1000 inst
l2 miss              212437512662   # 38.83% l2 miss
cpu-cycles           5628197624978  # 85.4% memory latency
load stalls          4804943018686  # 24.1% l1 bound
l1 miss              3448039312113  # 38.0% l2 bound
l2 miss              1310663434850  # 23.3% l3 bound
l3 miss              956314300      #  0.0% dram bound
store_stalls         3981547654     #  0.1% store bound
Process summary shows time in the ebizzy application.
824 processes
	476 ebizzy               147756.72    17.82
	 68 clinfo                  14.88     8.31
	 38 vulkaninfo               1.33     1.14
	  4 vulkani:disk$0           0.15     0.12
	  6 php                      0.09     0.14
	  2 llvmpipe-0               0.08     0.06
	  2 llvmpipe-1               0.08     0.06
	  2 llvmpipe-10              0.08     0.06
	  2 llvmpipe-11              0.08     0.06
	  2 llvmpipe-12              0.08     0.06
	  2 llvmpipe-13              0.08     0.06
	  2 llvmpipe-14              0.08     0.06
	  2 llvmpipe-15              0.08     0.06
	  2 llvmpipe-2               0.08     0.06
	  2 llvmpipe-3               0.08     0.06
	  2 llvmpipe-4               0.08     0.06
	  2 llvmpipe-5               0.08     0.06
	  2 llvmpipe-6               0.08     0.06
	  2 llvmpipe-7               0.08     0.06
	  2 llvmpipe-8               0.08     0.06
	  2 llvmpipe-9               0.08     0.06
	  6 glxinfo:gdrv0            0.07     0.11
	  6 glxinfo:gl0              0.07     0.11
	  6 clang                    0.06     0.06
	  2 glxinfo                  0.05     0.04
	  2 glxinfo:cs0              0.05     0.04
	  2 glxinfo:disk$0           0.05     0.04
	  2 glxinfo:sh0              0.05     0.04
	  2 glxinfo:shlo0            0.05     0.04
	  1 lspci                    0.00     0.02
	 82 sh                       0.00     0.00
	 13 gcc                      0.00     0.00
	 13 gsettings                0.00     0.00
	  8 stat                     0.00     0.00
	  8 systemd-detect-          0.00     0.00
	  6 llvm-link                0.00     0.00
	  5 phoronix-test-s          0.00     0.00
	  3 rocminfo                 0.00     0.00
	  2 cc                       0.00     0.00
	  2 gmain                    0.00     0.00
	  2 lscpu                    0.00     0.00
	  2 uname                    0.00     0.00
	  2 which                    0.00     0.00
	  2 xset                     0.00     0.00
	  1 date                     0.00     0.00
	  1 dconf worker             0.00     0.00
	  1 dirname                  0.00     0.00
	  1 dmesg                    0.00     0.00
	  1 dmidecode                0.00     0.00
	  1 grep                     0.00     0.00
	  1 ifconfig                 0.00     0.00
	  1 ip                       0.00     0.00
	  1 lsmod                    0.00     0.00
	  1 mktemp                   0.00     0.00
	  1 ps                       0.00     0.00
	  1 qdbus                    0.00     0.00
	  1 readlink                 0.00     0.00
	  1 realpath                 0.00     0.00
	  1 sed                      0.00     0.00
	  1 sort                     0.00     0.00
	  1 stty                     0.00     0.00
	  1 systemctl                0.00     0.00
	  1 template.sh              0.00     0.00
	  1 wc                       0.00     0.00
	  1 xrandr                   0.00     0.00
0 processes running
47 maximum processes
Computation blocks look as follows
      958113) ebizzy           cpu=6 start=5.64  finish=25.65
        958114) ebizzy           cpu=15 start=5.64  finish=25.65
          958115) ebizzy           cpu=9 start=5.64  finish=25.65
          958116) ebizzy           cpu=12 start=5.64  finish=25.65
          958117) ebizzy           cpu=2 start=5.64  finish=25.65
          958118) ebizzy           cpu=0 start=5.64  finish=25.65
          958119) ebizzy           cpu=7 start=5.64  finish=25.65
          958120) ebizzy           cpu=0 start=5.64  finish=25.65
          958121) ebizzy           cpu=4 start=5.64  finish=25.65
          958122) ebizzy           cpu=2 start=5.64  finish=25.64
          958123) ebizzy           cpu=4 start=5.64  finish=25.64
          958124) ebizzy           cpu=10 start=5.64  finish=25.64
          958125) ebizzy           cpu=12 start=5.64  finish=25.64
          958126) ebizzy           cpu=13 start=5.64  finish=25.64
          958127) ebizzy           cpu=8 start=5.64  finish=25.64
          958128) ebizzy           cpu=11 start=5.64  finish=25.64
          958129) ebizzy           cpu=13 start=5.64  finish=25.64
          958130) ebizzy           cpu=1 start=5.64  finish=25.64
          958131) ebizzy           cpu=4 start=5.64  finish=25.64
          958132) ebizzy           cpu=15 start=5.64  finish=25.64
          958133) ebizzy           cpu=3 start=5.64  finish=25.64
          958134) ebizzy           cpu=14 start=5.64  finish=25.64
          958135) ebizzy           cpu=3 start=5.64  finish=25.64
          958136) ebizzy           cpu=10 start=5.64  finish=25.64
          958137) ebizzy           cpu=11 start=5.64  finish=25.64
          958138) ebizzy           cpu=6 start=5.64  finish=25.64
          958139) ebizzy           cpu=1 start=5.64  finish=25.64
          958140) ebizzy           cpu=6 start=5.64  finish=25.64
          958141) ebizzy           cpu=5 start=5.64  finish=25.64
          958142) ebizzy           cpu=15 start=5.64  finish=25.64
          958143) ebizzy           cpu=9 start=5.64  finish=25.64
          958144) ebizzy           cpu=14 start=5.64  finish=25.64
          958145) ebizzy           cpu=8 start=5.64  finish=25.64
          958146) ebizzy           cpu=7 start=5.64  finish=25.64