
Encode-flac is one of several quick-running encode benchmarks. These are quick-running high-IPC programs with just a few threads.

This benchmark has a high retirement rate and is more CPU-bound than memory bound with low L2 miss.
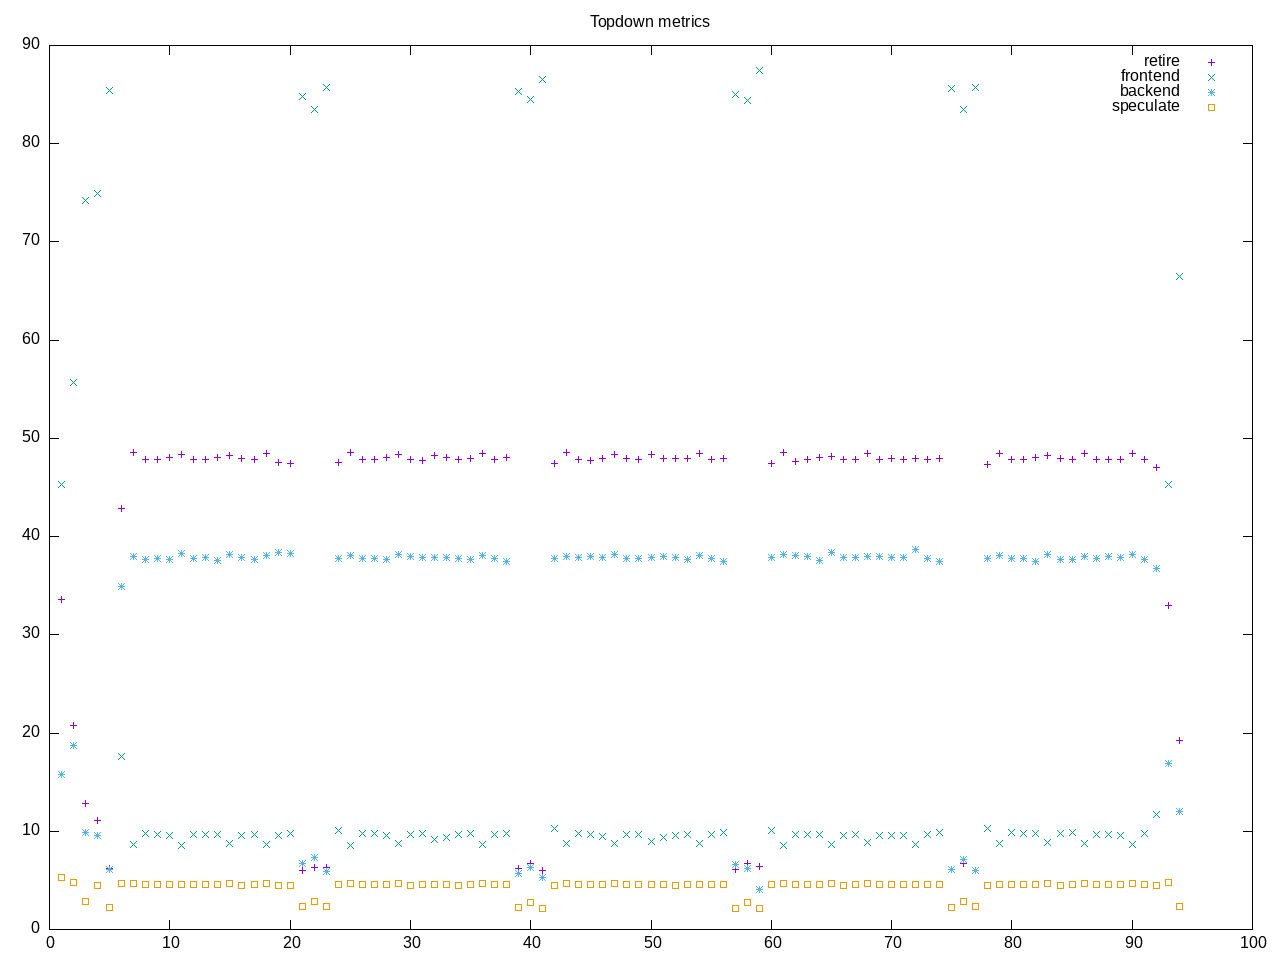
AMD metrics show floating point code with not many branches.
elapsed              93.904
on_cpu               0.048          # 0.76 / 16 cores
utime                66.862
stime                4.649
nvcsw                3722           # 87.95%
nivcsw               510            # 12.05%
inblock              0              # 0.00/sec
onblock              5640680        # 60068.41/sec
cpu-clock            71525785522    # 71.526 seconds
task-clock           71529766766    # 71.530 seconds
page faults          162447         # 2271.041/sec
context switches     4477           # 62.589/sec
cpu migrations       270            # 3.775/sec
major page faults    2              # 0.028/sec
minor page faults    162445         # 2271.013/sec
alignment faults     0              # 0.000/sec
emulation faults     0              # 0.000/sec
branches             65228324666    # 71.850 branches per 1000 inst
branch misses        1591404724     # 2.44% branch miss
conditional          59579320218    # 65.628 conditional branches per 1000 inst
indirect             490112514      # 0.540 indirect branches per 1000 inst
cpu-cycles           323977802299   # 0.22 GHz
instructions         904831623895   # 2.79 IPC
slots                651847439922   #
retiring             311005626504   # 47.7% (47.7%)
-- ucode             65161529       #     0.0%
-- fastpath          310940464975   #    47.7%
frontend             65843616795    # 10.1% (10.1%)
-- latency           46788223812    #     7.2%
-- bandwidth         19055392983    #     2.9%
backend              244873674549   # 37.6% (37.6%)
-- cpu               153325136436   #    23.5%
-- memory            91548538113    #    14.0%
speculation          30043583943    #  4.6% ( 4.6%)
-- branch mispredict 29995069423    #     4.6%
-- pipeline restart  48514520       #     0.0%
smt-contention       80673799       #  0.0% ( 0.0%)
cpu-cycles           323744049163   # 0.22 GHz
instructions         904518738078   # 2.79 IPC
instructions         302395723028   # 15.402 l2 access per 1000 inst
l2 hit from l1       3959063208     # 2.31% l2 miss
l2 miss from l1      61181661       #
l2 hit from l2 pf    652279775      #
l3 hit from l2 pf    20257366       #
l3 miss from l2 pf   25932827       #
instructions         302701668926   # 166.545 float per 1000 inst
float 512            96             # 0.000 AVX-512 per 1000 inst
float 256            548            # 0.000 AVX-256 per 1000 inst
float 128            50413408213    # 166.545 AVX-128 per 1000 inst
float MMX            0              # 0.000 MMX per 1000 inst
float scalar         0              # 0.000 scalar per 1000 inst
Intel metrics
elapsed              113.828
on_cpu               0.048          # 0.76 / 16 cores
utime                83.861
stime                3.127
nvcsw                2748           # 86.50%
nivcsw               429            # 13.50%
inblock              162072         # 1423.83/sec
onblock              5629448        # 49455.54/sec
cpu-clock            86979198019    # 86.979 seconds
task-clock           86983205871    # 86.983 seconds
page faults          146728         # 1686.854/sec
context switches     3522           # 40.491/sec
cpu migrations       337            # 3.874/sec
major page faults    11             # 0.126/sec
minor page faults    146717         # 1686.728/sec
alignment faults     0              # 0.000/sec
emulation faults     0              # 0.000/sec
branches             63988050279    # 70.760 branches per 1000 inst
branch misses        1163447765     # 1.82% branch miss
conditional          63988063783    # 70.760 conditional branches per 1000 inst
indirect             487545594      # 0.539 indirect branches per 1000 inst
slots                1954170198794  #
retiring             942912014258   # 48.3% (48.3%)
-- ucode             99080065199    #     5.1%
-- fastpath          843831949059   #    43.2%
frontend             104879180630   #  5.4% ( 5.4%)
-- latency           40085804158    #     2.1%
-- bandwidth         64793376472    #     3.3%
backend              751955215673   # 38.5% (38.5%)
-- cpu               625940284325   #    32.0%
-- memory            126014931348   #     6.4%
speculation          160840325105   #  8.2% ( 8.2%)
-- branch mispredict 157503943312   #     8.1%
-- pipeline restart  3336381793     #     0.2%
smt-contention       0              #  0.0% ( 0.0%)
cpu-cycles           326126427127   # 0.18 GHz
instructions         904427032045   # 2.77 IPC
l2 access            7350624832     # 8.130 l2 access per 1000 inst
l2 miss              336115083      # 4.57% l2 miss
Process structure shows test overhead (clinfo) is a significant portion of time.
397 processes
	 50 flac                    65.80     3.55
	 68 clinfo                  15.86     5.99
	 38 vulkaninfo               1.14     1.14
	  4 vulkani:disk$0           0.12     0.12
	  6 glxinfo:gdrv0            0.12     0.09
	  2 llvmpipe-0               0.06     0.06
	  2 llvmpipe-1               0.06     0.06
	  2 llvmpipe-10              0.06     0.06
	  2 llvmpipe-11              0.06     0.06
	  2 llvmpipe-12              0.06     0.06
	  2 llvmpipe-13              0.06     0.06
	  2 llvmpipe-14              0.06     0.06
	  2 llvmpipe-15              0.06     0.06
	  2 llvmpipe-2               0.06     0.06
	  2 llvmpipe-3               0.06     0.06
	  2 llvmpipe-4               0.06     0.06
	  2 llvmpipe-5               0.06     0.06
	  2 llvmpipe-6               0.06     0.06
	  2 llvmpipe-7               0.06     0.06
	  2 llvmpipe-8               0.06     0.06
	  2 llvmpipe-9               0.06     0.06
	  2 glxinfo                  0.06     0.04
	  2 glxinfo:cs0              0.06     0.04
	  2 glxinfo:disk$0           0.06     0.04
	  2 glxinfo:sh0              0.06     0.04
	  2 glxinfo:shlo0            0.06     0.04
	  6 php                      0.05     0.10
	  6 clang                    0.04     0.07
	  3 rocminfo                 0.03     0.00
	  1 lspci                    0.00     0.03
	 82 sh                       0.00     0.00
	 13 gcc                      0.00     0.00
	 10 gsettings                0.00     0.00
	  8 stat                     0.00     0.00
	  8 systemd-detect-          0.00     0.00
	  6 llvm-link                0.00     0.00
	  5 encode-flac              0.00     0.00
	  5 phoronix-test-s          0.00     0.00
	  4 gmain                    0.00     0.00
	  2 cc                       0.00     0.00
	  2 dconf worker             0.00     0.00
	  2 lscpu                    0.00     0.00
	  2 uname                    0.00     0.00
	  2 which                    0.00     0.00
	  2 xset                     0.00     0.00
	  1 date                     0.00     0.00
	  1 dirname                  0.00     0.00
	  1 dmesg                    0.00     0.00
	  1 dmidecode                0.00     0.00
	  1 grep                     0.00     0.00
	  1 ifconfig                 0.00     0.00
	  1 ip                       0.00     0.00
	  1 lsmod                    0.00     0.00
	  1 mktemp                   0.00     0.00
	  1 ps                       0.00     0.00
	  1 qdbus                    0.00     0.00
	  1 readlink                 0.00     0.00
	  1 realpath                 0.00     0.00
	  1 sed                      0.00     0.00
	  1 sort                     0.00     0.00
	  1 stty                     0.00     0.00
	  1 systemctl                0.00     0.00
	  1 template.sh              0.00     0.00
	  1 wc                       0.00     0.00
	  1 xrandr                   0.00     0.00
0 processes running
47 maximum processes
Process structure shows processes launched in groups of 10, though not all of them run as shown by process queue at top of the page.
      40642) encode-flac      cpu=15 start=5.64  finish=19.65
        40643) flac             cpu=1 start=5.65  finish=7.29
        40644) flac             cpu=15 start=7.29  finish=8.67
        40645) flac             cpu=1 start=8.67  finish=10.03
        40646) flac             cpu=15 start=10.03 finish=11.41
        40647) flac             cpu=1 start=11.42 finish=12.78
        40648) flac             cpu=7 start=12.78 finish=14.16
        40649) flac             cpu=0 start=14.16 finish=15.53
        40652) flac             cpu=15 start=15.53 finish=16.91
        40653) flac             cpu=9 start=16.91 finish=18.28
        40654) flac             cpu=2 start=18.28 finish=19.65