
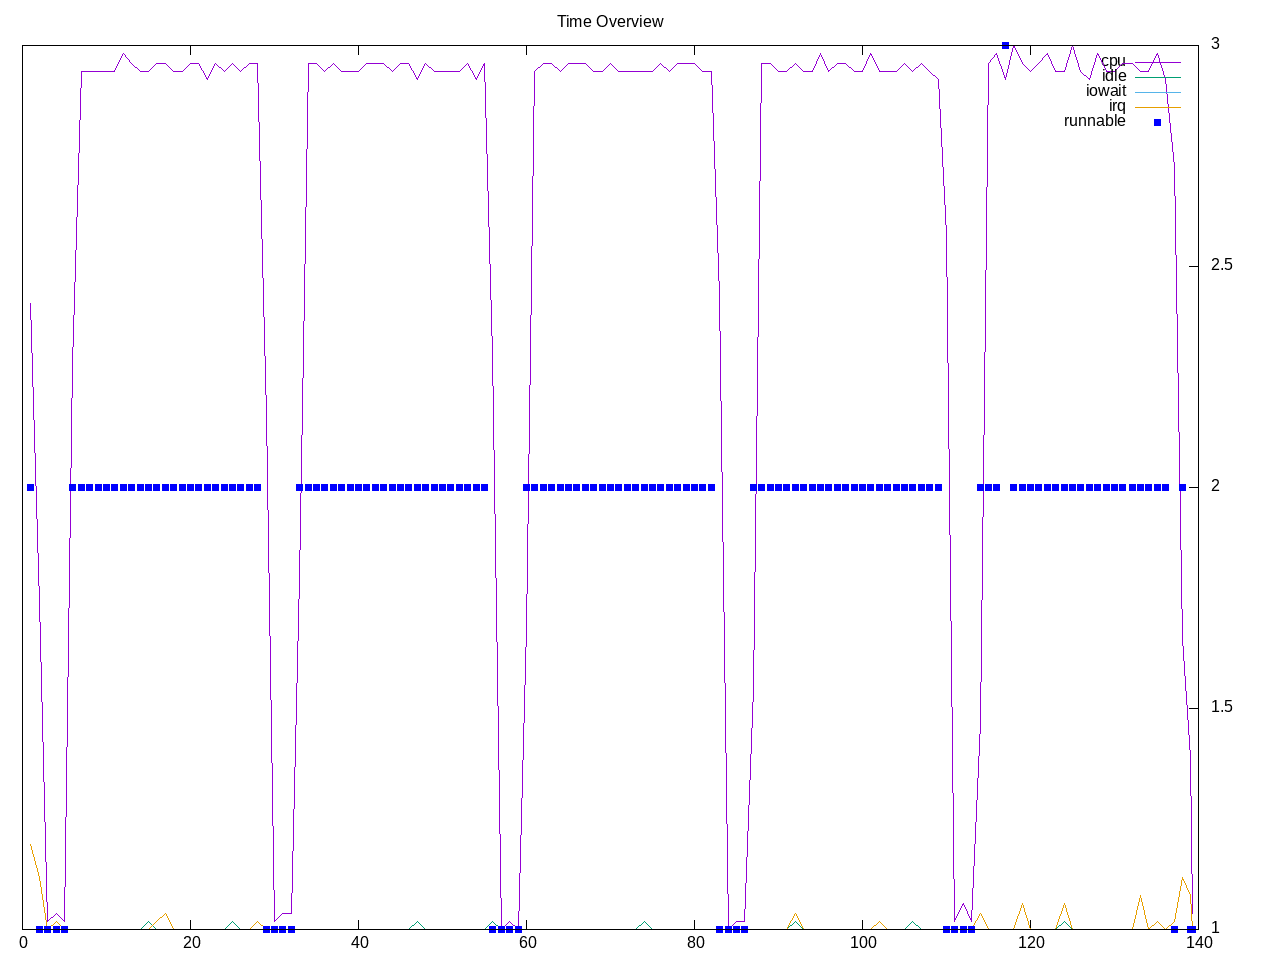
Encode-opus is one of several quick-running encode benchmarks. These are quick-running high-IPC programs with just a few threads. In this case, a constant set of two runnable processes.
System overview shows a high retirement rate with a small number of backend stalls.

AMD metrics show a lot of floating point code, not many branches and cpu-bound more than memory bound but overall very high IPC and high retirement rate.
elapsed              139.297
on_cpu               0.053          # 0.84 / 16 cores
utime                115.226
stime                1.839
nvcsw                2815           # 81.74%
nivcsw               629            # 18.26%
inblock              0              # 0.00/sec
onblock              1732768        # 12439.35/sec
cpu-clock            117091880626   # 117.092 seconds
task-clock           117095710268   # 117.096 seconds
page faults          161156         # 1376.276/sec
context switches     3933           # 33.588/sec
cpu migrations       300            # 2.562/sec
major page faults    2              # 0.017/sec
minor page faults    161154         # 1376.259/sec
alignment faults     0              # 0.000/sec
emulation faults     0              # 0.000/sec
branches             153579074036   # 94.603 branches per 1000 inst
branch misses        2912235529     # 1.90% branch miss
conditional          134250372526   # 82.697 conditional branches per 1000 inst
indirect             1193893855     # 0.735 indirect branches per 1000 inst
cpu-cycles           537156399526   # 0.24 GHz
instructions         1619661764279  # 3.02 IPC
slots                1076831653824  #
retiring             523624378763   # 48.6% (48.6%)
-- ucode             27642325       #     0.0%
-- fastpath          523596736438   #    48.6%
frontend             100476135520   #  9.3% ( 9.3%)
-- latency           65112118866    #     6.0%
-- bandwidth         35364016654    #     3.3%
backend              364834219382   # 33.9% (33.9%)
-- cpu               279301543322   #    25.9%
-- memory            85532676060    #     7.9%
speculation          87781529545    #  8.2% ( 8.2%)
-- branch mispredict 86601453537    #     8.0%
-- pipeline restart  1180076008     #     0.1%
smt-contention       115109929      #  0.0% ( 0.0%)
cpu-cycles           537866827145   # 0.24 GHz
instructions         1622228251326  # 3.02 IPC
instructions         541136738630   # 17.839 l2 access per 1000 inst
l2 hit from l1       6466702852     # 2.16% l2 miss
l2 miss from l1      106528981      #
l2 hit from l2 pf    3085379042     #
l3 hit from l2 pf    91625958       #
l3 miss from l2 pf   9890270        #
instructions         540965737285   # 358.276 float per 1000 inst
float 512            112            # 0.000 AVX-512 per 1000 inst
float 256            602            # 0.000 AVX-256 per 1000 inst
float 128            193814859934   # 358.276 AVX-128 per 1000 inst
float MMX            0              # 0.000 MMX per 1000 inst
float scalar         0              # 0.000 scalar per 1000 inst
Intel metrics show a similar low amount of on cpu, essentially single-threaded.
elapsed              158.215
on_cpu               0.053          # 0.86 / 16 cores
utime                133.985
stime                1.313
nvcsw                2331           # 77.65%
nivcsw               671            # 22.35%
inblock              81936          # 517.88/sec
onblock              1721520        # 10880.86/sec
cpu-clock            135300390813   # 135.300 seconds
task-clock           135304167762   # 135.304 seconds
page faults          145874         # 1078.119/sec
context switches     3580           # 26.459/sec
cpu migrations       366            # 2.705/sec
major page faults    18             # 0.133/sec
minor page faults    145856         # 1077.986/sec
alignment faults     0              # 0.000/sec
emulation faults     0              # 0.000/sec
branches             152826156114   # 94.293 branches per 1000 inst
branch misses        2865383218     # 1.87% branch miss
conditional          152826169330   # 94.293 conditional branches per 1000 inst
indirect             1214079796     # 0.749 indirect branches per 1000 inst
slots                3067321672538  #
retiring             1541367561479  # 50.3% (50.3%)
-- ucode             48525608582    #     1.6%
-- fastpath          1492841952897  #    48.7%
frontend             293193133379   #  9.6% ( 9.6%)
-- latency           110784373995   #     3.6%
-- bandwidth         182408759384   #     5.9%
backend              805991778923   # 26.3% (26.3%)
-- cpu               581617263000   #    19.0%
-- memory            224374515923   #     7.3%
speculation          431547827766   # 14.1% (14.1%)
-- branch mispredict 424707967622   #    13.8%
-- pipeline restart  6839860144     #     0.2%
smt-contention       0              #  0.0% ( 0.0%)
cpu-cycles           511371921430   # 0.20 GHz
instructions         1620717767784  # 3.17 IPC
l2 access            9846953252     # 6.076 l2 access per 1000 inst
l2 miss              321920749      # 3.27% l2 miss
Process summary is straightforward
387 processes
	 25 opusenc                114.12     0.86
	 68 clinfo                  16.20     6.31
	 38 vulkaninfo               0.94     1.15
	  6 glxinfo:gdrv0            0.12     0.06
	  4 vulkani:disk$0           0.10     0.13
	  6 php                      0.08     0.06
	  2 glxinfo                  0.07     0.03
	  2 glxinfo:cs0              0.07     0.03
	  2 glxinfo:disk$0           0.07     0.03
	  2 glxinfo:shlo0            0.07     0.03
	  2 glxinfo:sh0              0.06     0.02
	  6 clang                    0.05     0.07
	  2 llvmpipe-0               0.05     0.07
	  2 llvmpipe-1               0.05     0.07
	  2 llvmpipe-10              0.05     0.07
	  2 llvmpipe-11              0.05     0.07
	  2 llvmpipe-12              0.05     0.07
	  2 llvmpipe-13              0.05     0.07
	  2 llvmpipe-14              0.05     0.07
	  2 llvmpipe-2               0.05     0.07
	  2 llvmpipe-4               0.05     0.07
	  2 llvmpipe-5               0.05     0.07
	  2 llvmpipe-6               0.05     0.07
	  2 llvmpipe-7               0.05     0.07
	  2 llvmpipe-8               0.05     0.07
	  2 llvmpipe-9               0.05     0.07
	  2 llvmpipe-15              0.05     0.06
	  2 llvmpipe-3               0.05     0.06
	  3 rocminfo                 0.03     0.00
	  1 lspci                    0.01     0.02
	  1 ps                       0.00     0.01
	 87 sh                       0.00     0.00
	 13 gcc                      0.00     0.00
	 12 gsettings                0.00     0.00
	  8 stat                     0.00     0.00
	  8 systemd-detect-          0.00     0.00
	  6 llvm-link                0.00     0.00
	  5 bash                     0.00     0.00
	  5 encode-opus              0.00     0.00
	  5 phoronix-test-s          0.00     0.00
	  5 rm                       0.00     0.00
	  3 gmain                    0.00     0.00
	  2 cc                       0.00     0.00
	  2 lscpu                    0.00     0.00
	  2 uname                    0.00     0.00
	  2 which                    0.00     0.00
	  2 xset                     0.00     0.00
	  1 date                     0.00     0.00
	  1 dconf worker             0.00     0.00
	  1 dirname                  0.00     0.00
	  1 dmesg                    0.00     0.00
	  1 dmidecode                0.00     0.00
	  1 grep                     0.00     0.00
	  1 ifconfig                 0.00     0.00
	  1 ip                       0.00     0.00
	  1 lsmod                    0.00     0.00
	  1 mktemp                   0.00     0.00
	  1 qdbus                    0.00     0.00
	  1 readlink                 0.00     0.00
	  1 realpath                 0.00     0.00
	  1 sed                      0.00     0.00
	  1 sort                     0.00     0.00
	  1 stty                     0.00     0.00
	  1 systemctl                0.00     0.00
	  1 template.sh              0.00     0.00
	  1 wc                       0.00     0.00
	  1 xrandr                   0.00     0.00
0 processes running
47 maximum processes
The core computation blocks show a parent process followed by five children in order.
      45221) encode-opus      cpu=14 start=5.62  finish=28.68
        45222) opusenc          cpu=3 start=5.62  finish=10.44
        45223) opusenc          cpu=15 start=10.44 finish=15.01
        45226) opusenc          cpu=0 start=15.01 finish=19.57
        45227) opusenc          cpu=15 start=19.57 finish=24.13
        45228) opusenc          cpu=0 start=24.13 finish=28.68