
A fast version of ericson texture compression. This has four workloads. The first two look multi-threaded and the last two single-threaded.
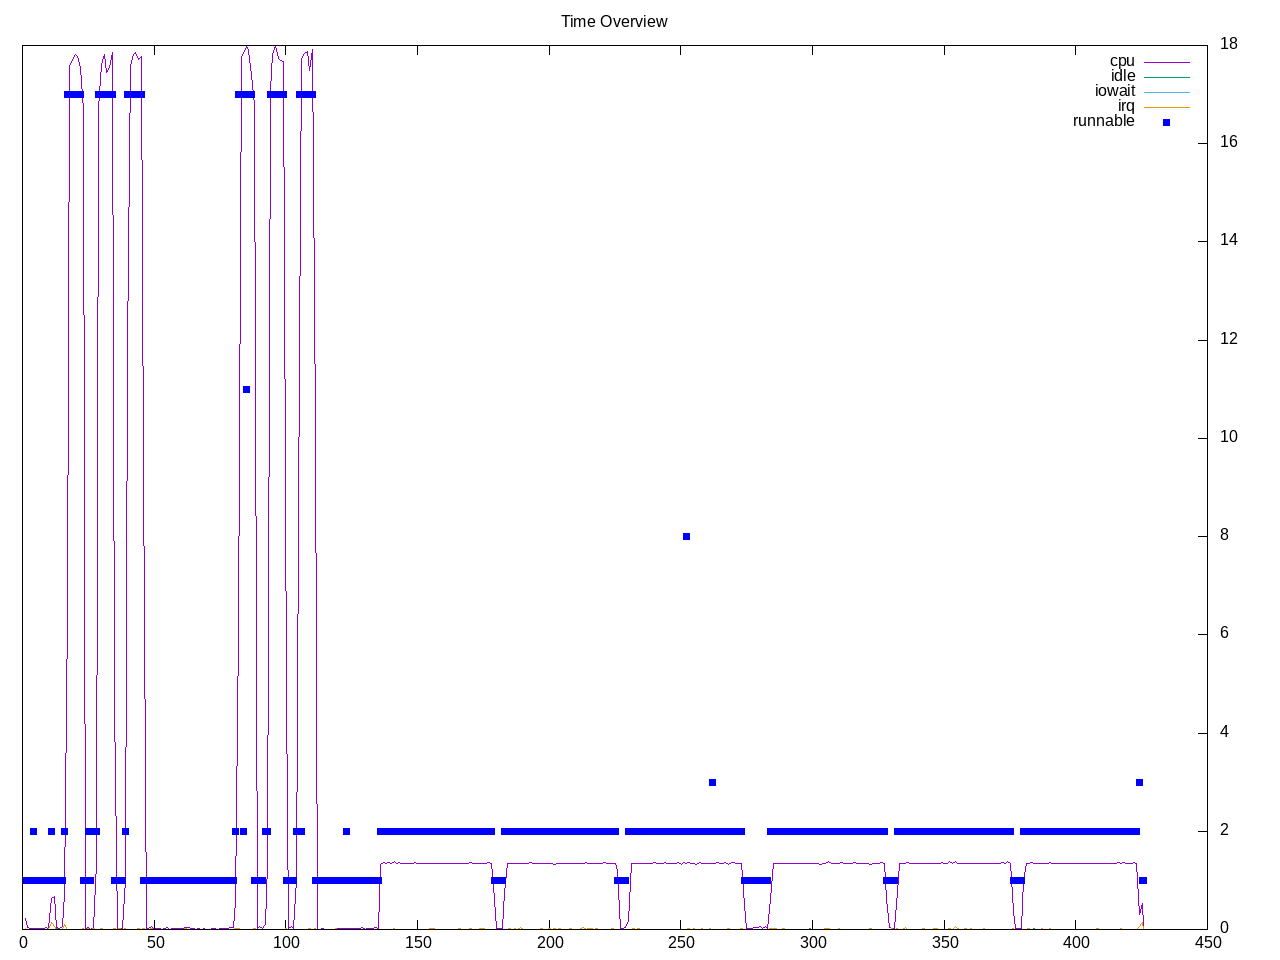
Topdown profile shows an overall higher retirement rate with some backend stalls. Branch misses look higher than average.
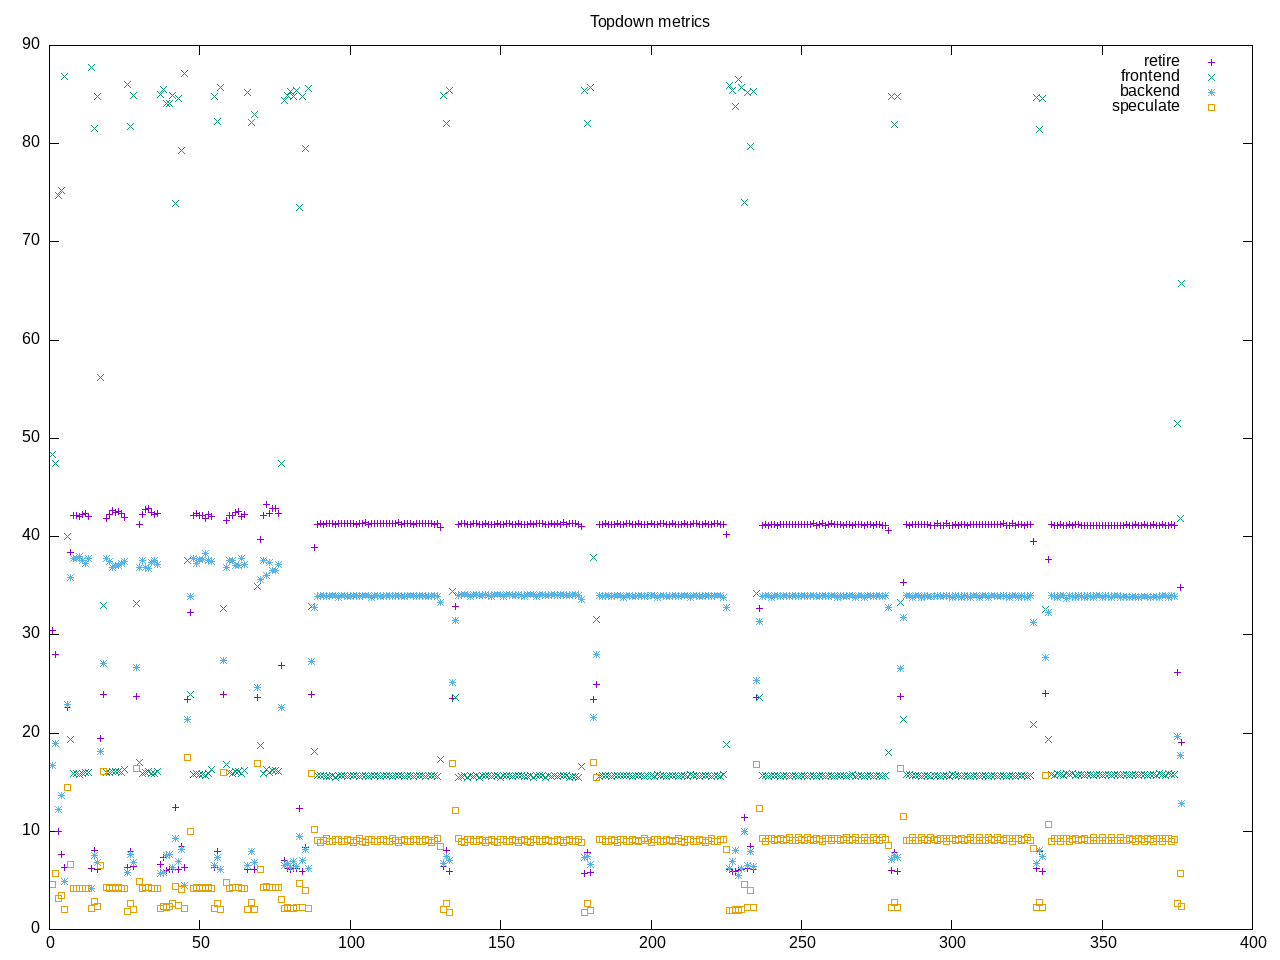
AMD metrics show floating point code, low levels of L2 access. Backend stalls are more CPU than memory.
elapsed              379.185
on_cpu               0.127          # 2.03 / 16 cores
utime                695.160
stime                73.650
nvcsw                33939          # 79.16%
nivcsw               8933           # 20.84%
inblock              0              # 0.00/sec
onblock              13072          # 34.47/sec
cpu-clock            768605623724   # 768.606 seconds
task-clock           768683156709   # 768.683 seconds
page faults          40265127       # 52381.956/sec
context switches     44571          # 57.984/sec
cpu migrations       728            # 0.947/sec
major page faults    2              # 0.003/sec
minor page faults    40265125       # 52381.953/sec
alignment faults     0              # 0.000/sec
emulation faults     0              # 0.000/sec
branches             322067504448   # 53.327 branches per 1000 inst
branch misses        19026737996    # 5.91% branch miss
conditional          261678731073   # 43.328 conditional branches per 1000 inst
indirect             2411440948     # 0.399 indirect branches per 1000 inst
cpu-cycles           3143167306570  # 0.52 GHz
instructions         6014440828700  # 1.91 IPC
slots                6299593694976  #
retiring             2064474000665  # 32.8% (41.4%)
-- ucode             17942446201    #     0.3%
-- fastpath          2046531554464  #    32.5%
frontend             809225698829   # 12.8% (16.2%)
-- latency           547271642676   #     8.7%
-- bandwidth         261954056153   #     4.2%
backend              1774056180250  # 28.2% (35.6%)
-- cpu               1117262901849  #    17.7%
-- memory            656793278401   #    10.4%
speculation          339046574585   #  5.4% ( 6.8%)
-- branch mispredict 337884265343   #     5.4%
-- pipeline restart  1162309242     #     0.0%
smt-contention       1312785174486  # 20.8% ( 0.0%)
cpu-cycles           3136549829895  # 0.52 GHz
instructions         6011087700746  # 1.92 IPC
instructions         2007447939680  # 8.024 l2 access per 1000 inst
l2 hit from l1       11062739284    # 26.83% l2 miss
l2 miss from l1      486228979      #
l2 hit from l2 pf    1209907993     #
l3 hit from l2 pf    708610652      #
l3 miss from l2 pf   3126294311     #
instructions         2010826750680  # 267.182 float per 1000 inst
float 512            49             # 0.000 AVX-512 per 1000 inst
float 256            380            # 0.000 AVX-256 per 1000 inst
float 128            537257423693   # 267.182 AVX-128 per 1000 inst
float MMX            0              # 0.000 MMX per 1000 inst
float scalar         0              # 0.000 scalar per 1000 inst
instructions         6022694670998  #
opcache              927164558278   # 153.945 opcache per 1000 inst
opcache miss         56305763687    #  6.1% opcache miss rate
l1 dTLB miss         954245753      # 0.158 L1 dTLB per 1000 inst
l2 dTLB miss         206814759      # 0.034 L2 dTLB per 1000 inst
instructions         6022972249053  #
icache               110398259315   # 18.330 icache per 1000 inst
icache miss          9028214708     #  8.2% icache miss rate
l1 iTLB miss         9538498        # 0.002 L1 iTLB per 1000 inst
l2 iTLB miss         0              # 0.000 L2 iTLB per 1000 inst
tlb flush            23646          # 0.000 TLB flush per 1000 inst
Intel metrics
elapsed              475.332
on_cpu               0.130          # 2.09 / 16 cores
utime                939.204
stime                52.098
nvcsw                32300          # 71.25%
nivcsw               13036          # 28.75%
inblock              1136           # 2.39/sec
onblock              1736           # 3.65/sec
cpu-clock            990936944257   # 990.937 seconds
task-clock           990980198648   # 990.980 seconds
page faults          40260308       # 40626.753/sec
context switches     47515          # 47.947/sec
cpu migrations       5556           # 5.607/sec
major page faults    0              # 0.000/sec
minor page faults    40260308       # 40626.753/sec
alignment faults     0              # 0.000/sec
emulation faults     0              # 0.000/sec
branches             310052567082   # 49.041 branches per 1000 inst
branch misses        12993611831    # 4.19% branch miss
conditional          310052583722   # 49.041 conditional branches per 1000 inst
indirect             40474888197    # 6.402 indirect branches per 1000 inst
slots                11846758328900 #
retiring             5119661056273  # 43.2% (43.2%)
-- ucode             304518481434   #     2.6%
-- fastpath          4815142574839  #    40.6%
frontend             1266742842987  # 10.7% (10.7%)
-- latency           964654096534   #     8.1%
-- bandwidth         302088746453   #     2.5%
backend              3986359025539  # 33.6% (33.6%)
-- cpu               3603962998717  #    30.4%
-- memory            382396026822   #     3.2%
speculation          1471295695168  # 12.4% (12.4%) high
-- branch mispredict 1430113408581  #    12.1%
-- pipeline restart  41182286587    #     0.3%
smt-contention       0              #  0.0% ( 0.0%)
cpu-cycles           3696784401081  # 0.49 GHz
instructions         7221215707281  # 1.95 IPC
l2 access            34425025841    # 6.898 l2 access per 1000 inst
l2 miss              17807291225    # 51.73% l2 miss
cpu-cycles           2550674883434  #  8.5% memory latency
load stalls          203370913214   #  6.1% l1 bound
l1 miss              46953318482    #  1.3% l2 bound
l2 miss              12616747498    #  0.2% l3 bound
l3 miss              8507747116     #  0.3% dram bound
store_stalls         14693094374    #  0.6% store bound
Process overview
480 processes
	 36 etcpak                 706.06    73.79
	 68 clinfo                  16.86     5.66
	 38 vulkaninfo               1.14     1.33
	  4 vulkani:disk$0           0.12     0.14
	  6 php                      0.09     0.13
	  6 glxinfo:gdrv0            0.08     0.09
	  6 glxinfo:gl0              0.07     0.09
	  2 llvmpipe-0               0.06     0.07
	  2 llvmpipe-1               0.06     0.07
	  2 llvmpipe-10              0.06     0.07
	  2 llvmpipe-11              0.06     0.07
	  2 llvmpipe-12              0.06     0.07
	  2 llvmpipe-13              0.06     0.07
	  2 llvmpipe-14              0.06     0.07
	  2 llvmpipe-15              0.06     0.07
	  2 llvmpipe-2               0.06     0.07
	  2 llvmpipe-3               0.06     0.07
	  2 llvmpipe-4               0.06     0.07
	  2 llvmpipe-5               0.06     0.07
	  2 llvmpipe-6               0.06     0.07
	  2 llvmpipe-7               0.06     0.07
	  2 llvmpipe-8               0.06     0.07
	  2 llvmpipe-9               0.06     0.07
	  6 clang                    0.06     0.06
	  2 glxinfo                  0.06     0.03
	  2 glxinfo:cs0              0.06     0.03
	  2 glxinfo:disk$0           0.06     0.03
	  2 glxinfo:sh0              0.06     0.03
	  2 glxinfo:shlo0            0.06     0.03
	  3 rocminfo                 0.03     0.00
	  6 Worker 0                 0.00   459.87
	  6 Worker 1                 0.00   459.87
	  6 Worker 13                0.00   459.87
	  6 Worker 2                 0.00   459.87
	  6 Worker 3                 0.00   459.87
	  6 Worker 6                 0.00   459.87
	  6 Worker 7                 0.00   459.87
	  6 Worker 8                 0.00   459.87
	  6 Worker 9                 0.00   459.87
	  6 Worker 10                0.00   459.86
	  6 Worker 11                0.00   459.86
	  6 Worker 12                0.00   459.86
	  6 Worker 14                0.00   459.86
	  6 Worker 4                 0.00   459.86
	  6 Worker 5                 0.00   459.86
	  1 lspci                    0.00     0.03
	  1 ps                       0.00     0.01
	 88 sh                       0.00     0.00
	 13 gcc                      0.00     0.00
	  9 gsettings                0.00     0.00
	  8 stat                     0.00     0.00
	  8 systemd-detect-          0.00     0.00
	  6 llvm-link                0.00     0.00
	  5 phoronix-test-s          0.00     0.00
	  4 gmain                    0.00     0.00
	  3 dconf worker             0.00     0.00
	  2 cc                       0.00     0.00
	  2 lscpu                    0.00     0.00
	  2 uname                    0.00     0.00
	  2 which                    0.00     0.00
	  2 xset                     0.00     0.00
	  1 date                     0.00     0.00
	  1 dirname                  0.00     0.00
	  1 dmesg                    0.00     0.00
	  1 dmidecode                0.00     0.00
	  1 grep                     0.00     0.00
	  1 ifconfig                 0.00     0.00
	  1 ip                       0.00     0.00
	  1 lsmod                    0.00     0.00
	  1 mktemp                   0.00     0.00
	  1 qdbus                    0.00     0.00
	  1 readlink                 0.00     0.00
	  1 realpath                 0.00     0.00
	  1 sed                      0.00     0.00
	  1 sort                     0.00     0.00
	  1 stty                     0.00     0.00
	  1 systemctl                0.00     0.00
	  1 template.sh              0.00     0.00
	  1 wc                       0.00     0.00
	  1 xrandr                   0.00     0.00
0 processes running
47 maximum processes
Computation blocks
      998072) etcpak           cpu=2 start=5.66  finish=13.05
        998073) etcpak           cpu=2 start=5.66  finish=13.05
          998074) etcpak           cpu=1 start=5.66  finish=6.72
          998075) Worker 0         cpu=-1 start=6.72  finish=13.04
          998076) Worker 1         cpu=-1 start=6.73  finish=13.04
          998077) Worker 2         cpu=-1 start=6.73  finish=13.04
          998078) Worker 3         cpu=-1 start=6.73  finish=13.04
          998079) Worker 4         cpu=-1 start=6.73  finish=13.04
          998080) Worker 5         cpu=-1 start=6.73  finish=13.04
          998081) Worker 6         cpu=-1 start=6.73  finish=13.04
          998082) Worker 7         cpu=-1 start=6.73  finish=13.04
          998083) Worker 8         cpu=-1 start=6.73  finish=13.04
          998084) Worker 9         cpu=-1 start=6.73  finish=13.04
          998085) Worker 10        cpu=-1 start=6.73  finish=13.04
          998086) Worker 11        cpu=-1 start=6.73  finish=13.04
          998087) Worker 12        cpu=-1 start=6.73  finish=13.04
          998088) Worker 13        cpu=-1 start=6.73  finish=13.04
          998089) Worker 14        cpu=-1 start=6.73  finish=13.04