
Faiss has difficulty installing on my AMD and Intel systems with the following error.
-- Found SWIG: /usr/bin/swig4.0 (found version "4.0.2") found components: python
CMake Error at /usr/local/cmake-3.24.2-linux-x86_64/share/cmake-3.24/Modules/FindPackageHandleStandardArgs.cmake:230 (message):
  Could NOT find Python (missing: Python_INCLUDE_DIRS Python_LIBRARIES
  Python_NumPy_INCLUDE_DIRS Development NumPy Development.Module
  Development.Embed)
Call Stack (most recent call first):
  /usr/local/cmake-3.24.2-linux-x86_64/share/cmake-3.24/Modules/FindPackageHandleStandardArgs.cmake:594 (_FPHSA_FAILURE_MESSAGE)
  /usr/local/cmake-3.24.2-linux-x86_64/share/cmake-3.24/Modules/FindPython.cmake:561 (find_package_handle_standard_args)
  faiss/python/CMakeLists.txt:122 (find_package)


-- Configuring incomplete, errors occurred!
See also "/home/mev/.phoronix-test-suite/installed-tests/pts/faiss-1.0.1/faiss-1.7.4/build/CMakeFiles/CMakeOutput.log".
make: Nothing to be done for 'faiss'.
make: *** No rule to make target 'demo_sift1M'.  Stop.
It does run on my 7950x and so numbers below are running on 7950x. There are two separate test cases, the sift1M appears to run in parallel and the polysemous_sift1m appears to run mostly sequentially.
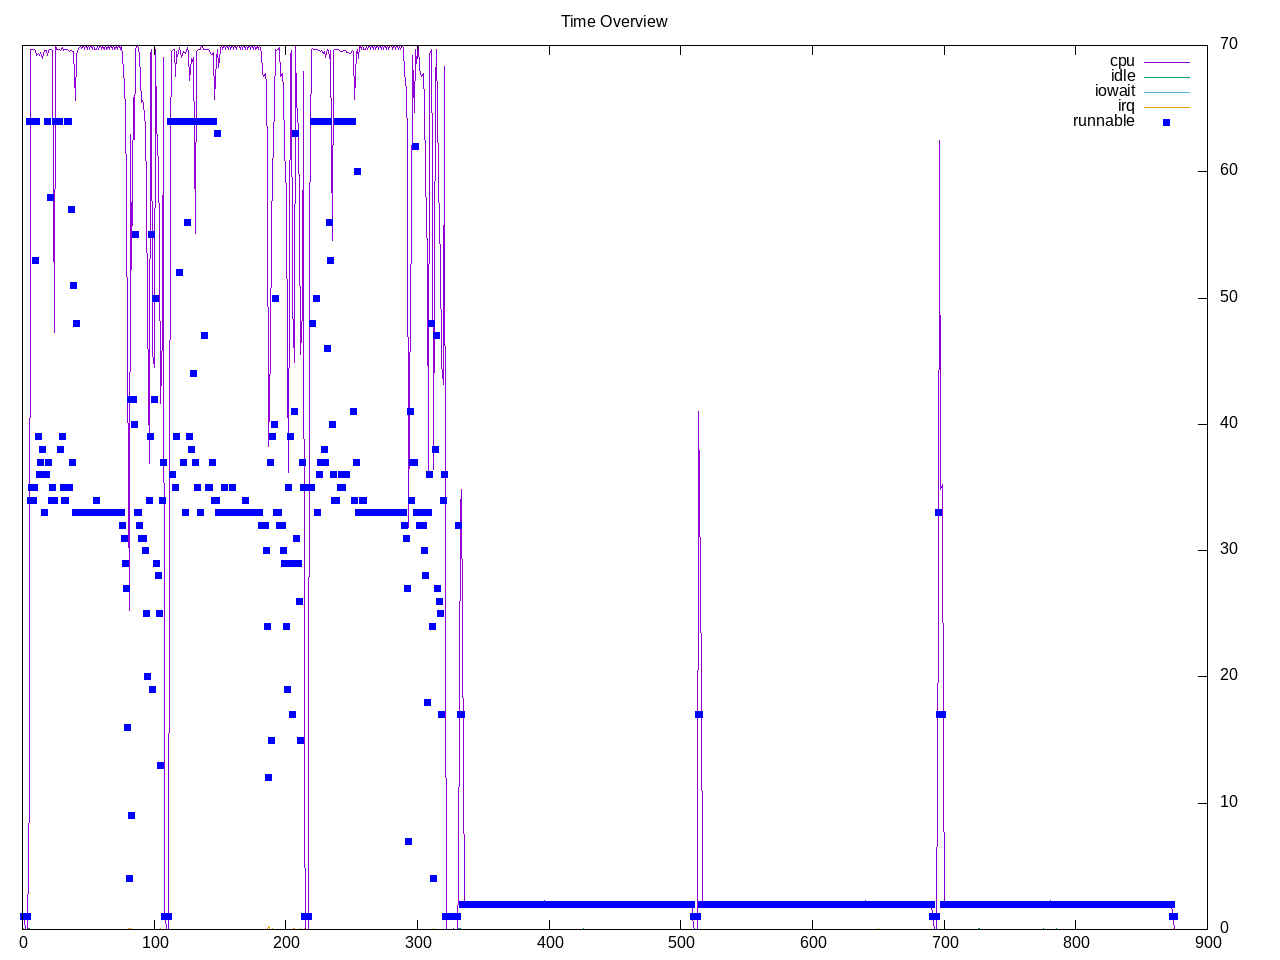
Topdown profile suggests the first workload is mostly backend bound and the second workload has high amounts of branch mis-prediction. There is also a increasing retirement rate at end of the second runs.
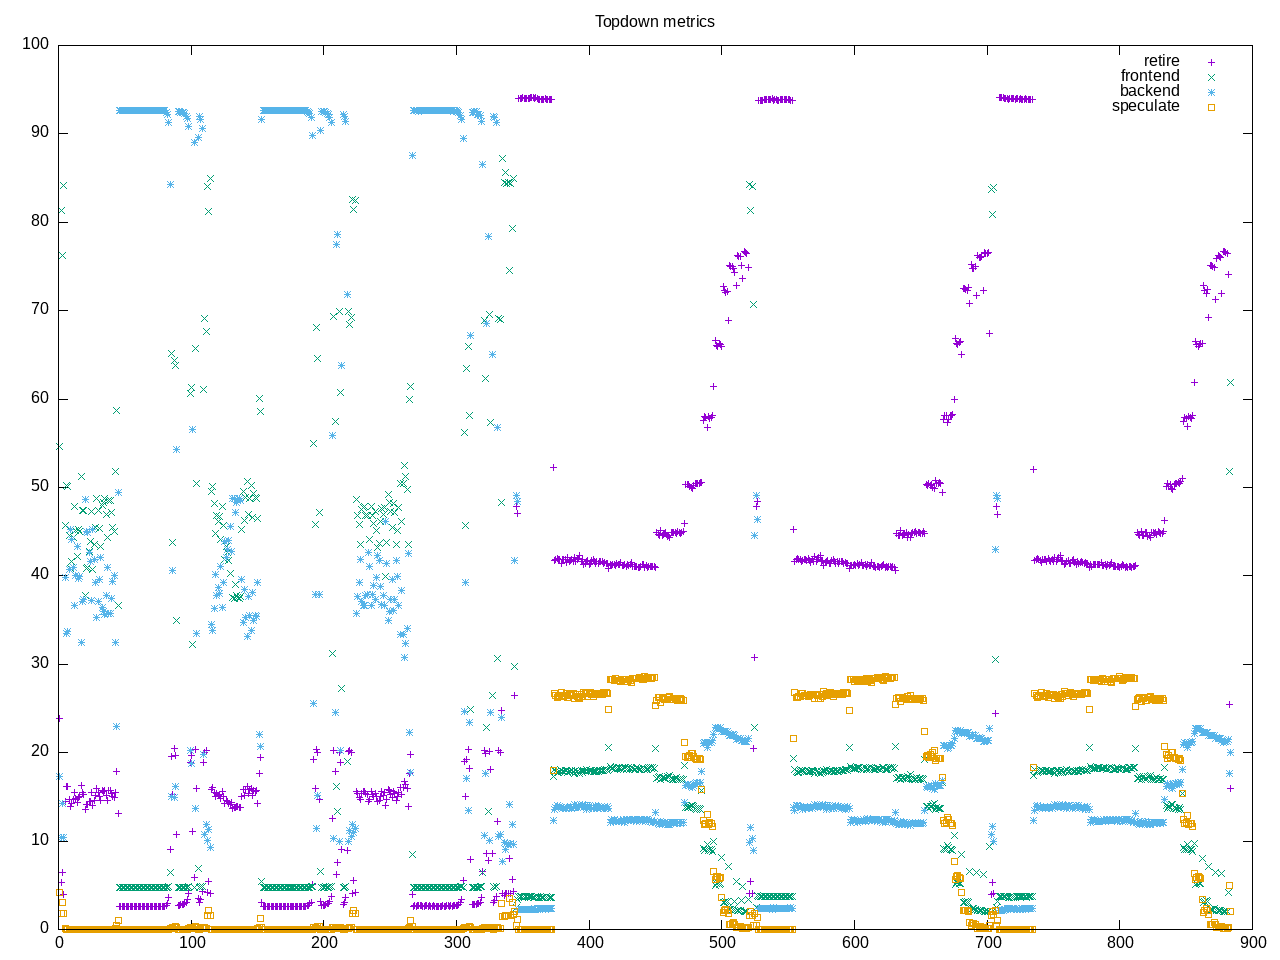
AMD metrics are a composite of the two workloads (and probably useful separating these out). This has a fair amount of both floating point and branch instructions. The L2 access is moderate with a reasonable amount of misses. The backend stalls are more from memory than cpu. Speculation summary is only 1% which seems low compared to the chart above. Perhaps some of the on-cpu also plays a factor here? In any case useful to separate out since the workloads are different.
elapsed              869.631
on_cpu               0.363          # 11.63 / 32 cores
utime                7824.815
stime                2286.367
nvcsw                345115         # 0.36%
nivcsw               95899855       # 99.64%
inblock              32             # 0.04/sec
onblock              45312          # 52.10/sec
cpu-clock            10112254056407 # 10112.254 seconds
task-clock           10112344576263 # 10112.345 seconds
page faults          5412507        # 535.238/sec
context switches     96249164       # 9517.987/sec
cpu migrations       18452          # 1.825/sec
major page faults    91             # 0.009/sec
minor page faults    5412416        # 535.229/sec
alignment faults     0              # 0.000/sec
emulation faults     0              # 0.000/sec
branches             4484265783595  # 148.633 branches per 1000 inst
branch misses        376658179764   # 8.40% branch miss
conditional          3031234199466  # 100.471 conditional branches per 1000 inst
indirect             24800777321    # 0.822 indirect branches per 1000 inst
cpu-cycles           55108837758302 # 1.94 GHz
instructions         31810485809678 # 0.58 IPC low
slots                109890768993654 #
retiring             11452160474280 # 10.4% (11.8%) low
-- ucode             87545229664    #     0.1%
-- fastpath          11364615244616 #    10.3%
frontend             23175513915315 # 21.1% (23.9%)
-- latency           19277081880546 #    17.5%
-- bandwidth         3898432034769  #     3.5%
backend              61367037088759 # 55.8% (63.2%)
-- cpu               11100116100320 #    10.1%
-- memory            50266920988439 #    45.7%
speculation          1062297792803  #  1.0% ( 1.1%)
-- branch mispredict 1061377780753  #     1.0%
-- pipeline restart  920012050      #     0.0%
smt-contention       12833670979854 # 11.7% ( 0.0%)
cpu-cycles           55493401749010 # 1.95 GHz
instructions         31934426546886 # 0.58 IPC low
instructions         10611812357394 # 24.240 l2 access per 1000 inst
l2 hit from l1       140728666702   # 37.90% l2 miss
l2 miss from l1      7684990404     #
l2 hit from l2 pf    26683890472    #
l3 hit from l2 pf    36223074555    #
l3 miss from l2 pf   53590562992    #
instructions         10607128804634 # 148.187 float per 1000 inst
float 512            62             # 0.000 AVX-512 per 1000 inst
float 256            988            # 0.000 AVX-256 per 1000 inst
float 128            1571838885481  # 148.187 AVX-128 per 1000 inst
float MMX            0              # 0.000 MMX per 1000 inst
float scalar         4              # 0.000 scalar per 1000 inst
instructions         2600738        #
opcache              995459         # 382.760 opcache per 1000 inst
opcache miss         531806         # 53.4% opcache miss rate
l1 dTLB miss         5466           # 2.102 L1 dTLB per 1000 inst
l2 dTLB miss         1442           # 0.554 L2 dTLB per 1000 inst
instructions         2673428        #
icache               1336023        # 499.742 icache per 1000 inst
icache miss          112389         #  8.4% icache miss rate
l1 iTLB miss         10             # 0.004 L1 iTLB per 1000 inst
l2 iTLB miss         0              # 0.000 L2 iTLB per 1000 inst
tlb flush            19             # 0.007 TLB flush per 1000 inst
Process tree overview has demo_sift1M and python processes about equal amounts of user time, though demo_sift1M has a lot more system time.
760 processes
	189 demo_sift1M          451914.12 154385.23
	238 python3              41545.00   489.77
	 70 vulkaninfo               4.13     2.79
	  6 vulkani:disk$0           0.36     0.24
	  6 clinfo                   0.20     0.14
	  2 llvmpipe-0               0.12     0.08
	  2 llvmpipe-1               0.12     0.08
	  2 llvmpipe-10              0.12     0.08
	  2 llvmpipe-11              0.12     0.08
	  2 llvmpipe-12              0.12     0.08
	  2 llvmpipe-13              0.12     0.08
	  2 llvmpipe-14              0.12     0.08
	  2 llvmpipe-15              0.12     0.08
	  2 llvmpipe-16              0.12     0.08
	  2 llvmpipe-17              0.12     0.08
	  2 llvmpipe-18              0.12     0.08
	  2 llvmpipe-19              0.12     0.08
	  2 llvmpipe-2               0.12     0.08
	  2 llvmpipe-20              0.12     0.08
	  2 llvmpipe-21              0.12     0.08
	  2 llvmpipe-22              0.12     0.08
	  2 llvmpipe-23              0.12     0.08
	  2 llvmpipe-24              0.12     0.08
	  2 llvmpipe-25              0.12     0.08
	  2 llvmpipe-26              0.12     0.08
	  2 llvmpipe-27              0.12     0.08
	  2 llvmpipe-28              0.12     0.08
	  2 llvmpipe-29              0.12     0.08
	  2 llvmpipe-3               0.12     0.08
	  2 llvmpipe-30              0.12     0.08
	  2 llvmpipe-31              0.12     0.08
	  2 llvmpipe-4               0.12     0.08
	  2 llvmpipe-5               0.12     0.08
	  2 llvmpipe-6               0.12     0.08
	  2 llvmpipe-7               0.12     0.08
	  2 llvmpipe-8               0.12     0.08
	  2 llvmpipe-9               0.12     0.08
	  6 php                      0.05     0.25
	  6 glxinfo:gdrv0            0.05     0.06
	  6 glxinfo:gl0              0.05     0.06
	  2 glxinfo                  0.03     0.02
	  2 glxinfo:cs0              0.03     0.02
	  2 glxinfo:disk$0           0.03     0.02
	  2 glxinfo:sh0              0.03     0.02
	  2 glxinfo:shlo0            0.03     0.02
	 72 sh                       0.00     0.00
	 13 gcc                      0.00     0.00
	  8 stat                     0.00     0.00
	  8 systemd-detect-          0.00     0.00
	  6 faiss                    0.00     0.00
	  6 gsettings                0.00     0.00
	  5 dconf worker             0.00     0.00
	  5 gmain                    0.00     0.00
	  5 phoronix-test-s          0.00     0.00
	  2 cc                       0.00     0.00
	  2 lscpu                    0.00     0.00
	  2 uname                    0.00     0.00
	  2 which                    0.00     0.00
	  2 xset                     0.00     0.00
	  1 date                     0.00     0.00
	  1 dirname                  0.00     0.00
	  1 dmesg                    0.00     0.00
	  1 dmidecode                0.00     0.00
	  1 grep                     0.00     0.00
	  1 ifconfig                 0.00     0.00
	  1 ip                       0.00     0.00
	  1 lsmod                    0.00     0.00
	  1 lspci                    0.00     0.00
	  1 mktemp                   0.00     0.00
	  1 ps                       0.00     0.00
	  1 python                   0.00     0.00
	  1 readlink                 0.00     0.00
	  1 realpath                 0.00     0.00
	  1 sed                      0.00     0.00
	  1 sort                     0.00     0.00
	  1 stty                     0.00     0.00
	  1 systemctl                0.00     0.00
	  1 template.sh              0.00     0.00
	  1 wc                       0.00     0.00
	  1 xrandr                   0.00     0.00
0 processes running
80 maximum processes
Computation block for the initial workload
      312167) faiss            cpu=31 start=4.86  finish=107.25
        312168) demo_sift1M      cpu=7 start=4.87  finish=107.23
          312169) demo_sift1M      cpu=25 start=4.87  finish=107.22
          312170) demo_sift1M      cpu=10 start=4.87  finish=107.23
          312171) demo_sift1M      cpu=29 start=4.87  finish=107.23
          312172) demo_sift1M      cpu=30 start=4.87  finish=107.23
          312173) demo_sift1M      cpu=15 start=4.87  finish=107.23
          312174) demo_sift1M      cpu=4 start=4.87  finish=107.23
          312175) demo_sift1M      cpu=9 start=4.87  finish=107.23
          312176) demo_sift1M      cpu=20 start=4.87  finish=107.23
          312177) demo_sift1M      cpu=5 start=4.87  finish=107.23
          312178) demo_sift1M      cpu=10 start=4.87  finish=107.23
          312179) demo_sift1M      cpu=16 start=4.87  finish=107.23
          312180) demo_sift1M      cpu=28 start=4.87  finish=107.22
          312181) demo_sift1M      cpu=2 start=4.87  finish=107.22
          312182) demo_sift1M      cpu=18 start=4.87  finish=107.22
          312183) demo_sift1M      cpu=27 start=4.87  finish=107.22
          312184) demo_sift1M      cpu=23 start=4.87  finish=107.22
          312185) demo_sift1M      cpu=12 start=4.87  finish=107.22
          312186) demo_sift1M      cpu=26 start=4.87  finish=107.22
          312187) demo_sift1M      cpu=31 start=4.87  finish=107.22
          312188) demo_sift1M      cpu=1 start=4.87  finish=107.22
          312189) demo_sift1M      cpu=31 start=4.87  finish=107.22
          312190) demo_sift1M      cpu=0 start=4.87  finish=107.22
          312191) demo_sift1M      cpu=14 start=4.87  finish=107.22
          312192) demo_sift1M      cpu=24 start=4.87  finish=107.22
          312193) demo_sift1M      cpu=13 start=4.87  finish=107.22
          312194) demo_sift1M      cpu=15 start=4.87  finish=107.22
          312195) demo_sift1M      cpu=29 start=4.87  finish=107.22
          312196) demo_sift1M      cpu=3 start=4.87  finish=107.22
          312197) demo_sift1M      cpu=11 start=4.87  finish=107.22
          312198) demo_sift1M      cpu=8 start=4.87  finish=107.22
          312199) demo_sift1M      cpu=24 start=4.87  finish=107.22
          312200) demo_sift1M      cpu=4 start=4.91  finish=107.23
          312201) demo_sift1M      cpu=15 start=4.91  finish=107.23
          312202) demo_sift1M      cpu=23 start=4.91  finish=107.23
          312203) demo_sift1M      cpu=17 start=4.91  finish=107.23
          312204) demo_sift1M      cpu=2 start=4.91  finish=107.23
          312205) demo_sift1M      cpu=19 start=4.91  finish=107.23
          312206) demo_sift1M      cpu=6 start=4.91  finish=107.23
          312207) demo_sift1M      cpu=21 start=4.91  finish=107.23
          312208) demo_sift1M      cpu=16 start=4.91  finish=107.23
          312209) demo_sift1M      cpu=22 start=4.91  finish=107.23
          312210) demo_sift1M      cpu=1 start=4.91  finish=107.23
          312211) demo_sift1M      cpu=3 start=4.91  finish=107.23
          312212) demo_sift1M      cpu=18 start=4.91  finish=107.23
          312213) demo_sift1M      cpu=31 start=4.91  finish=107.23
          312214) demo_sift1M      cpu=20 start=4.91  finish=107.23
          312215) demo_sift1M      cpu=5 start=4.91  finish=107.23
          312216) demo_sift1M      cpu=0 start=4.91  finish=107.23
          312217) demo_sift1M      cpu=17 start=4.91  finish=107.23
          312218) demo_sift1M      cpu=4 start=4.91  finish=107.23
          312219) demo_sift1M      cpu=7 start=4.91  finish=107.23
          312220) demo_sift1M      cpu=3 start=4.91  finish=107.23
          312221) demo_sift1M      cpu=5 start=4.91  finish=107.23
          312222) demo_sift1M      cpu=22 start=4.91  finish=107.23
          312223) demo_sift1M      cpu=23 start=4.91  finish=107.23
          312224) demo_sift1M      cpu=20 start=4.91  finish=107.23
          312225) demo_sift1M      cpu=15 start=4.91  finish=107.23
          312226) demo_sift1M      cpu=31 start=4.91  finish=107.23
          312227) demo_sift1M      cpu=21 start=4.91  finish=107.23
          312228) demo_sift1M      cpu=1 start=4.91  finish=107.23
          312229) demo_sift1M      cpu=18 start=4.91  finish=107.23
          312230) demo_sift1M      cpu=2 start=4.91  finish=107.23
Computation blocks for the second workload
      312381) faiss            cpu=13 start=338.65 finish=516.02
        312382) python3          cpu=29 start=338.66 finish=516.02
          312383) python3          cpu=21 start=338.67 finish=516.02
          312384) python3          cpu=31 start=338.67 finish=516.02
          312385) python3          cpu=4 start=338.67 finish=516.02
          312386) python3          cpu=24 start=338.67 finish=516.02
          312387) python3          cpu=0 start=338.67 finish=516.02
          312388) python3          cpu=9 start=338.67 finish=516.02
          312389) python3          cpu=2 start=338.67 finish=516.02
          312390) python3          cpu=26 start=338.67 finish=516.02
          312391) python3          cpu=19 start=338.67 finish=516.02
          312392) python3          cpu=27 start=338.67 finish=516.02
          312393) python3          cpu=6 start=338.67 finish=516.02
          312394) python3          cpu=12 start=338.67 finish=516.02
          312395) python3          cpu=7 start=338.67 finish=516.02
          312396) python3          cpu=14 start=338.67 finish=516.02
          312397) python3          cpu=1 start=338.67 finish=516.02
          312398) python3          cpu=13 start=338.67 finish=516.02
          312399) python3          cpu=18 start=338.67 finish=516.02
          312400) python3          cpu=15 start=338.67 finish=516.02
          312401) python3          cpu=22 start=338.67 finish=516.02
          312402) python3          cpu=8 start=338.67 finish=516.02
          312403) python3          cpu=23 start=338.67 finish=516.02
          312404) python3          cpu=25 start=338.67 finish=516.02
          312405) python3          cpu=3 start=338.67 finish=516.02
          312406) python3          cpu=10 start=338.67 finish=516.02
          312407) python3          cpu=5 start=338.67 finish=516.02
          312408) python3          cpu=11 start=338.67 finish=516.02
          312409) python3          cpu=20 start=338.67 finish=516.02
          312410) python3          cpu=28 start=338.67 finish=516.02
          312411) python3          cpu=16 start=338.67 finish=516.02
          312412) python3          cpu=30 start=338.67 finish=516.02
          312413) python3          cpu=17 start=338.67 finish=516.02
          312414) python3          cpu=23 start=338.88 finish=516.02
          312415) python3          cpu=14 start=338.88 finish=516.02
          312416) python3          cpu=16 start=338.88 finish=516.02
          312417) python3          cpu=15 start=338.88 finish=516.02
          312418) python3          cpu=18 start=338.88 finish=516.02
          312419) python3          cpu=24 start=338.88 finish=516.02
          312420) python3          cpu=3 start=338.88 finish=516.02
          312421) python3          cpu=9 start=338.88 finish=516.02
          312422) python3          cpu=5 start=338.88 finish=516.02
          312423) python3          cpu=10 start=338.88 finish=516.02
          312424) python3          cpu=6 start=338.88 finish=516.02
          312425) python3          cpu=27 start=338.88 finish=516.02
          312426) python3          cpu=17 start=338.88 finish=516.02
          312427) python3          cpu=28 start=338.88 finish=516.02
          312428) python3          cpu=4 start=338.88 finish=516.02
          312429) python3          cpu=29 start=338.88 finish=339.21
          312430) python3          cpu=2 start=338.88 finish=339.21
          312431) python3          cpu=30 start=338.88 finish=339.21
          312432) python3          cpu=16 start=338.88 finish=339.21
          312433) python3          cpu=31 start=338.88 finish=339.21
          312434) python3          cpu=4 start=338.88 finish=339.21
          312435) python3          cpu=8 start=338.88 finish=339.21
          312436) python3          cpu=22 start=338.88 finish=339.21
          312437) python3          cpu=9 start=338.88 finish=339.21
          312438) python3          cpu=1 start=338.88 finish=339.21
          312439) python3          cpu=10 start=338.88 finish=339.21
          312440) python3          cpu=3 start=338.88 finish=339.21
          312441) python3          cpu=11 start=338.88 finish=339.21
          312442) python3          cpu=4 start=338.88 finish=339.21
          312443) python3          cpu=12 start=338.88 finish=339.21
          312444) python3          cpu=21 start=338.88 finish=339.21
          312445) python3          cpu=13 start=340.83 finish=516.02
          312446) python3          cpu=19 start=340.83 finish=516.02
          312447) python3          cpu=30 start=340.83 finish=516.02
          312448) python3          cpu=0 start=340.83 finish=516.02
          312449) python3          cpu=31 start=340.83 finish=516.02
          312450) python3          cpu=7 start=340.83 finish=516.02
          312451) python3          cpu=8 start=340.83 finish=516.02
          312452) python3          cpu=2 start=340.83 finish=516.02
          312453) python3          cpu=25 start=340.83 finish=516.02
          312454) python3          cpu=21 start=340.83 finish=516.02
          312455) python3          cpu=26 start=340.83 finish=516.02
          312456) python3          cpu=22 start=340.83 finish=516.02
          312457) python3          cpu=11 start=340.83 finish=516.02
          312458) python3          cpu=1 start=340.83 finish=516.02
          312459) python3          cpu=12 start=340.83 finish=516.02
          312460) python3          cpu=20 start=340.83 finish=516.02