
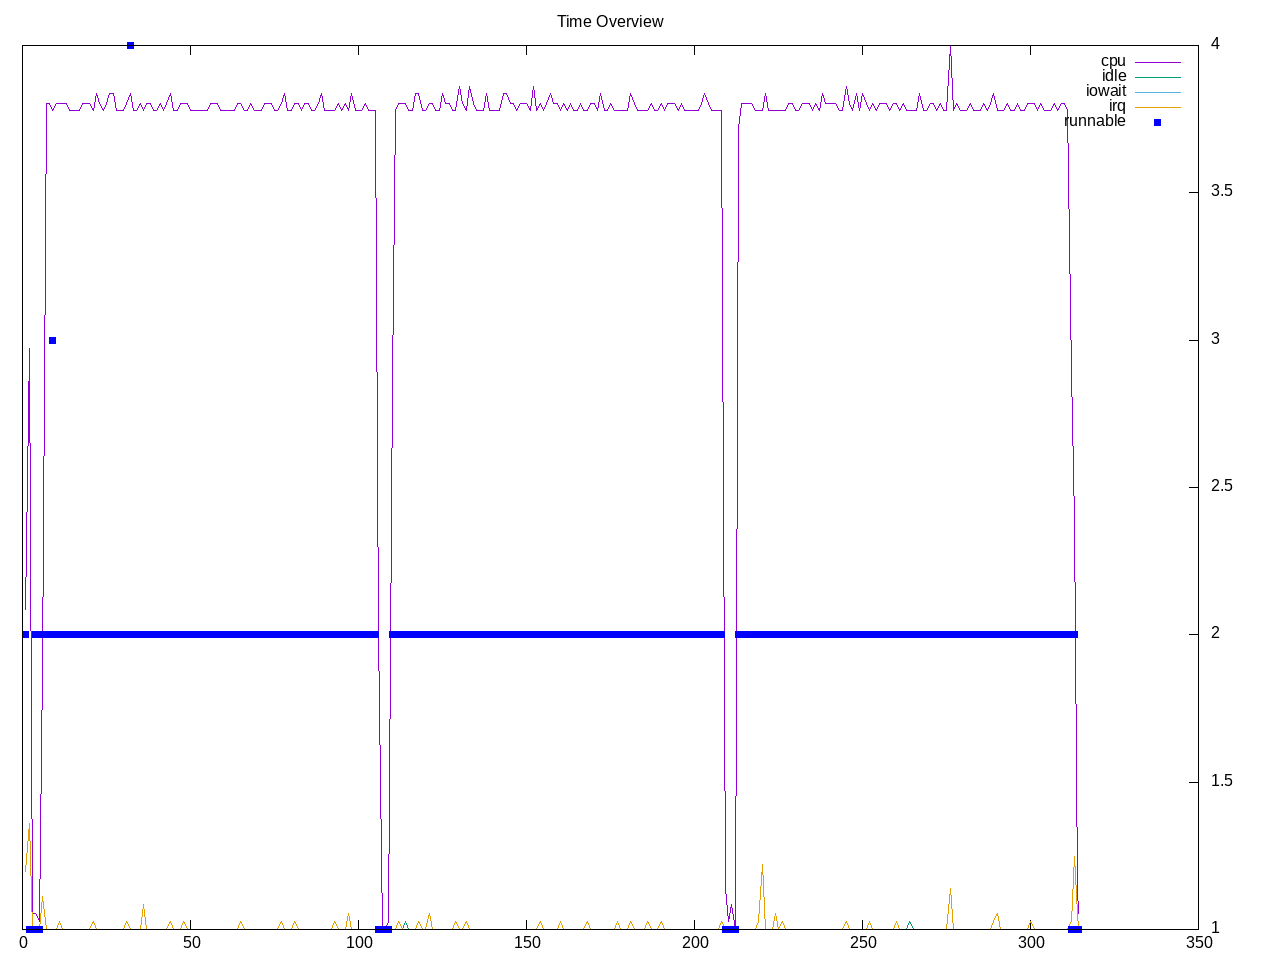
An integer benchmark that plays connect four. This is a single-threaded benchmark
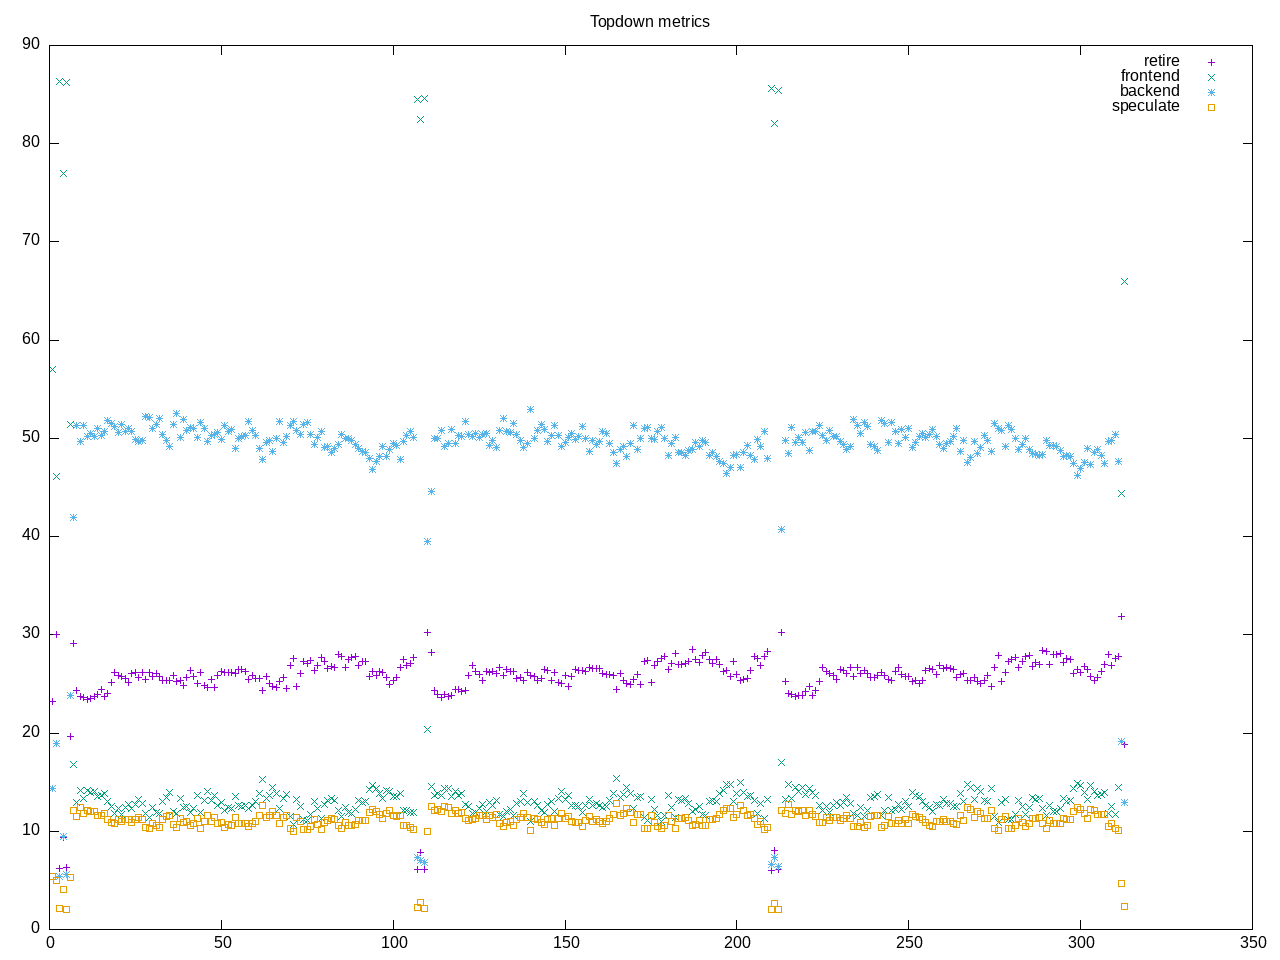
Topdown profile has backend stalls highest and also some branch mis-prediction.
AMD metrics confirm low floating point and low l2 access.
elapsed              312.054
on_cpu               0.060          # 0.95 / 16 cores
utime                296.897
stime                0.881
nvcsw                2042           # 63.73%
nivcsw               1162           # 36.27%
inblock              0              # 0.00/sec
onblock              12592          # 40.35/sec
cpu-clock            297841146459   # 297.841 seconds
task-clock           297846570054   # 297.847 seconds
page faults          196082         # 658.332/sec
context switches     4593           # 15.421/sec
cpu migrations       284            # 0.954/sec
major page faults    2              # 0.007/sec
minor page faults    196080         # 658.326/sec
alignment faults     0              # 0.000/sec
emulation faults     0              # 0.000/sec
branches             233327883545   # 104.871 branches per 1000 inst
branch misses        12686837013    # 5.44% branch miss
conditional          200759406002   # 90.232 conditional branches per 1000 inst
indirect             1917676634     # 0.862 indirect branches per 1000 inst
cpu-cycles           1384938128023  # 0.28 GHz
instructions         2224474557838  # 1.61 IPC
slots                2771980632678  #
retiring             725097197766   # 26.2% (26.2%)
-- ucode             11796409       #     0.0%
-- fastpath          725085401357   #    26.2%
frontend             361716878175   # 13.0% (13.0%)
-- latency           260290765254   #     9.4%
-- bandwidth         101426112921   #     3.7%
backend              1374264682599  # 49.6% (49.6%)
-- cpu               80682799574    #     2.9%
-- memory            1293581883025  #    46.7%
speculation          310843813950   # 11.2% (11.2%) high
-- branch mispredict 309522763990   #    11.2%
-- pipeline restart  1321049960     #     0.0%
smt-contention       57799883       #  0.0% ( 0.0%)
cpu-cycles           1392819774354  # 0.28 GHz
instructions         2223360442867  # 1.60 IPC
instructions         741458455985   # 2.865 l2 access per 1000 inst
l2 hit from l1       1423555319     # 67.07% l2 miss
l2 miss from l1      794340374      #
l2 hit from l2 pf    70235277       #
l3 hit from l2 pf    167165521      #
l3 miss from l2 pf   463258156      #
instructions         741628324732   # 0.221 float per 1000 inst
float 512            50             # 0.000 AVX-512 per 1000 inst
float 256            620            # 0.000 AVX-256 per 1000 inst
float 128            164066040      # 0.221 AVX-128 per 1000 inst
float MMX            0              # 0.000 MMX per 1000 inst
float scalar         0              # 0.000 scalar per 1000 inst
instructions         2224801463854  #
opcache              438936130733   # 197.292 opcache per 1000 inst
opcache miss         1048308708     #  0.2% opcache miss rate
l1 dTLB miss         2238351667     # 1.006 L1 dTLB per 1000 inst
l2 dTLB miss         1359849519     # 0.611 L2 dTLB per 1000 inst
instructions         2224803513056  #
icache               2054994127     # 0.924 icache per 1000 inst
icache miss          327607358      # 15.9% icache miss rate
l1 iTLB miss         9166304        # 0.004 L1 iTLB per 1000 inst
l2 iTLB miss         0              # 0.000 L2 iTLB per 1000 inst
tlb flush            16665          # 0.000 TLB flush per 1000 inst
Intel metrics
elapsed              343.927
on_cpu               0.060          # 0.96 / 16 cores
utime                329.738
stime                0.439
nvcsw                1846           # 53.48%
nivcsw               1606           # 46.52%
inblock              8              # 0.02/sec
onblock              1352           # 3.93/sec
cpu-clock            330219473625   # 330.219 seconds
task-clock           330223833301   # 330.224 seconds
page faults          186470         # 564.678/sec
context switches     4997           # 15.132/sec
cpu migrations       278            # 0.842/sec
major page faults    0              # 0.000/sec
minor page faults    186470         # 564.678/sec
alignment faults     0              # 0.000/sec
emulation faults     0              # 0.000/sec
branches             231157288340   # 104.123 branches per 1000 inst
branch misses        16171366041    # 7.00% branch miss
conditional          231157300180   # 104.123 conditional branches per 1000 inst
indirect             1923748155     # 0.867 indirect branches per 1000 inst
slots                7301781267950  #
retiring             1996958686283  # 27.3% (27.3%)
-- ucode             114931974763   #     1.6%
-- fastpath          1882026711520  #    25.8%
frontend             682187026144   #  9.3% ( 9.3%)
-- latency           364906500413   #     5.0%
-- bandwidth         317280525731   #     4.3%
backend              2383766707457  # 32.6% (32.6%)
-- cpu               620738229105   #     8.5%
-- memory            1763028478352  #    24.1%
speculation          2248370550539  # 30.8% (30.8%) high
-- branch mispredict 2248233525684  #    30.8%
-- pipeline restart  137024855      #     0.0%
smt-contention       0              #  0.0% ( 0.0%)
cpu-cycles           1216671318936  # 0.22 GHz
instructions         2220072072083  # 1.82 IPC
l2 access            13054101521    # 5.881 l2 access per 1000 inst
l2 miss              9005012687     # 68.98% l2 miss
cpu-cycles           1216942699639  # 31.7% memory latency
load stalls          385134577681   #  0.0% l1 bound
l1 miss              459783709265   # 11.6% l2 bound
l2 miss              318108276546   #  1.9% l3 bound
l3 miss              294978425345   # 24.2% dram bound
store_stalls         246520143      #  0.0% store bound
Process overview
354 processes
	  3 SearchGame             296.62     0.06
	 68 clinfo                  20.17     6.91
	 38 vulkaninfo               1.33     1.33
	  6 glxinfo:gdrv0            0.18     0.04
	  6 glxinfo:gl0              0.18     0.04
	  4 vulkani:disk$0           0.14     0.14
	  2 glxinfo                  0.08     0.02
	  2 glxinfo:cs0              0.08     0.02
	  2 glxinfo:disk$0           0.08     0.02
	  2 glxinfo:sh0              0.08     0.02
	  2 glxinfo:shlo0            0.08     0.02
	  6 php                      0.07     0.07
	  2 llvmpipe-0               0.07     0.07
	  2 llvmpipe-1               0.07     0.07
	  2 llvmpipe-10              0.07     0.07
	  2 llvmpipe-11              0.07     0.07
	  2 llvmpipe-12              0.07     0.07
	  2 llvmpipe-13              0.07     0.07
	  2 llvmpipe-14              0.07     0.07
	  2 llvmpipe-15              0.07     0.07
	  2 llvmpipe-2               0.07     0.07
	  2 llvmpipe-3               0.07     0.07
	  2 llvmpipe-4               0.07     0.07
	  2 llvmpipe-5               0.07     0.07
	  2 llvmpipe-6               0.07     0.07
	  2 llvmpipe-7               0.07     0.07
	  2 llvmpipe-8               0.07     0.07
	  2 llvmpipe-9               0.07     0.07
	  6 clang                    0.05     0.07
	  1 lspci                    0.00     0.03
	  3 rocminfo                 0.00     0.02
	  1 ps                       0.00     0.01
	 82 sh                       0.00     0.00
	 13 gcc                      0.00     0.00
	 10 gsettings                0.00     0.00
	  8 stat                     0.00     0.00
	  8 systemd-detect-          0.00     0.00
	  6 llvm-link                0.00     0.00
	  5 phoronix-test-s          0.00     0.00
	  4 gmain                    0.00     0.00
	  3 fhourstones-ben          0.00     0.00
	  2 cc                       0.00     0.00
	  2 dconf worker             0.00     0.00
	  2 lscpu                    0.00     0.00
	  2 uname                    0.00     0.00
	  2 which                    0.00     0.00
	  2 xset                     0.00     0.00
	  1 date                     0.00     0.00
	  1 dirname                  0.00     0.00
	  1 dmesg                    0.00     0.00
	  1 dmidecode                0.00     0.00
	  1 grep                     0.00     0.00
	  1 ifconfig                 0.00     0.00
	  1 ip                       0.00     0.00
	  1 lsmod                    0.00     0.00
	  1 mktemp                   0.00     0.00
	  1 qdbus                    0.00     0.00
	  1 readlink                 0.00     0.00
	  1 realpath                 0.00     0.00
	  1 sed                      0.00     0.00
	  1 sort                     0.00     0.00
	  1 stty                     0.00     0.00
	  1 systemctl                0.00     0.00
	  1 template.sh              0.00     0.00
	  1 wc                       0.00     0.00
	  1 xrandr                   0.00     0.00
0 processes running
47 maximum processes
Computation block
      1039809) fhourstones-ben  cpu=8 start=5.77  finish=103.54
        1039810) SearchGame       cpu=9 start=5.77  finish=103.54
      1039812) fhourstones-ben  cpu=4 start=107.54 finish=206.39
        1039813) SearchGame       cpu=13 start=107.55 finish=206.38
      1039815) fhourstones-ben  cpu=13 start=210.39 finish=310.51
        1039816) SearchGame       cpu=14 start=210.40 finish=310.51