
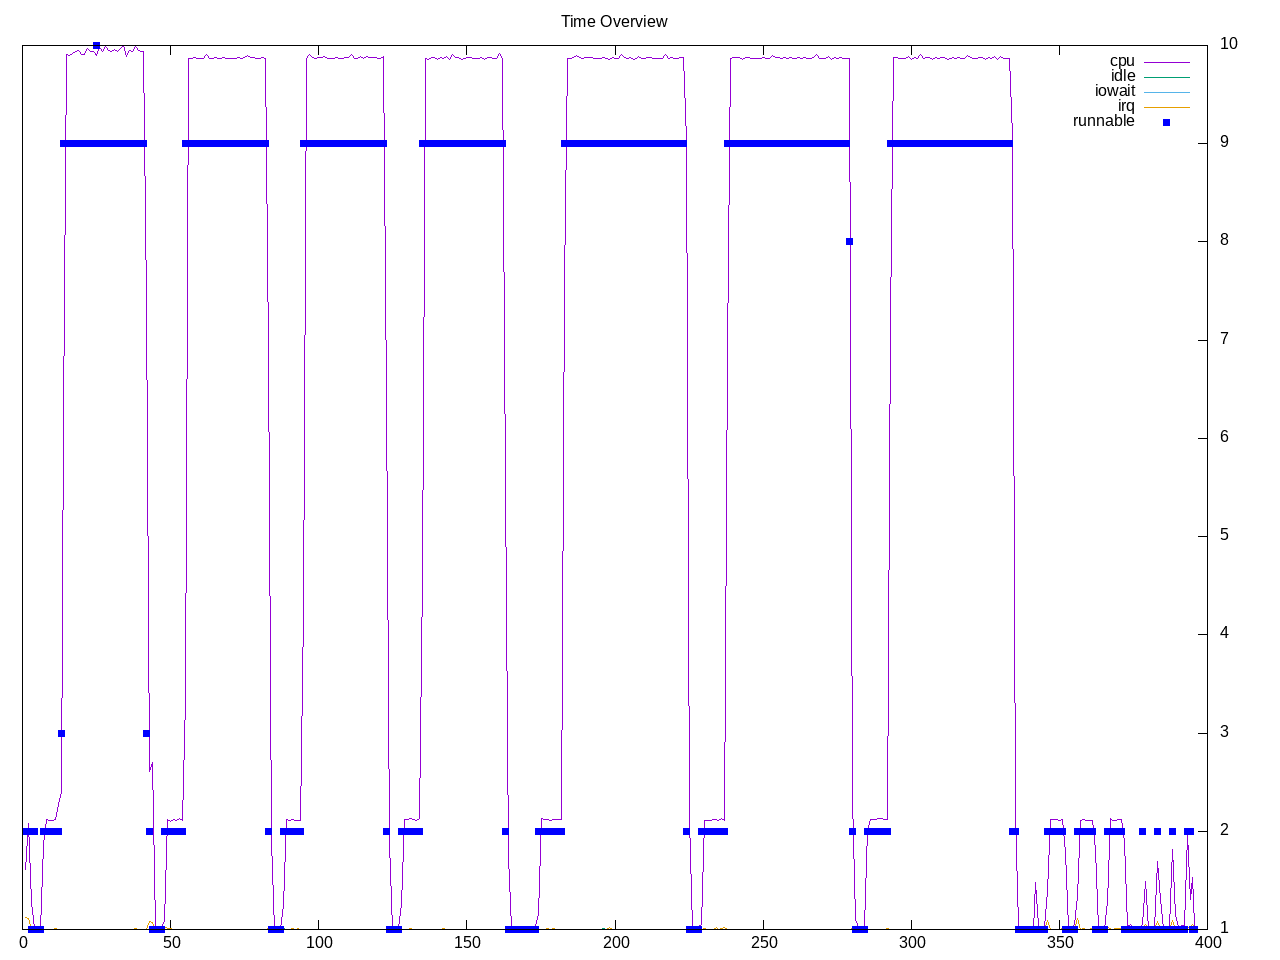
A collection of four financial benchmarks. Looks like the first two are multi-threaded on half the cores and take the majority of the time.
Topdown profile shows backend stalls as high but also a reasonable retirement rate.
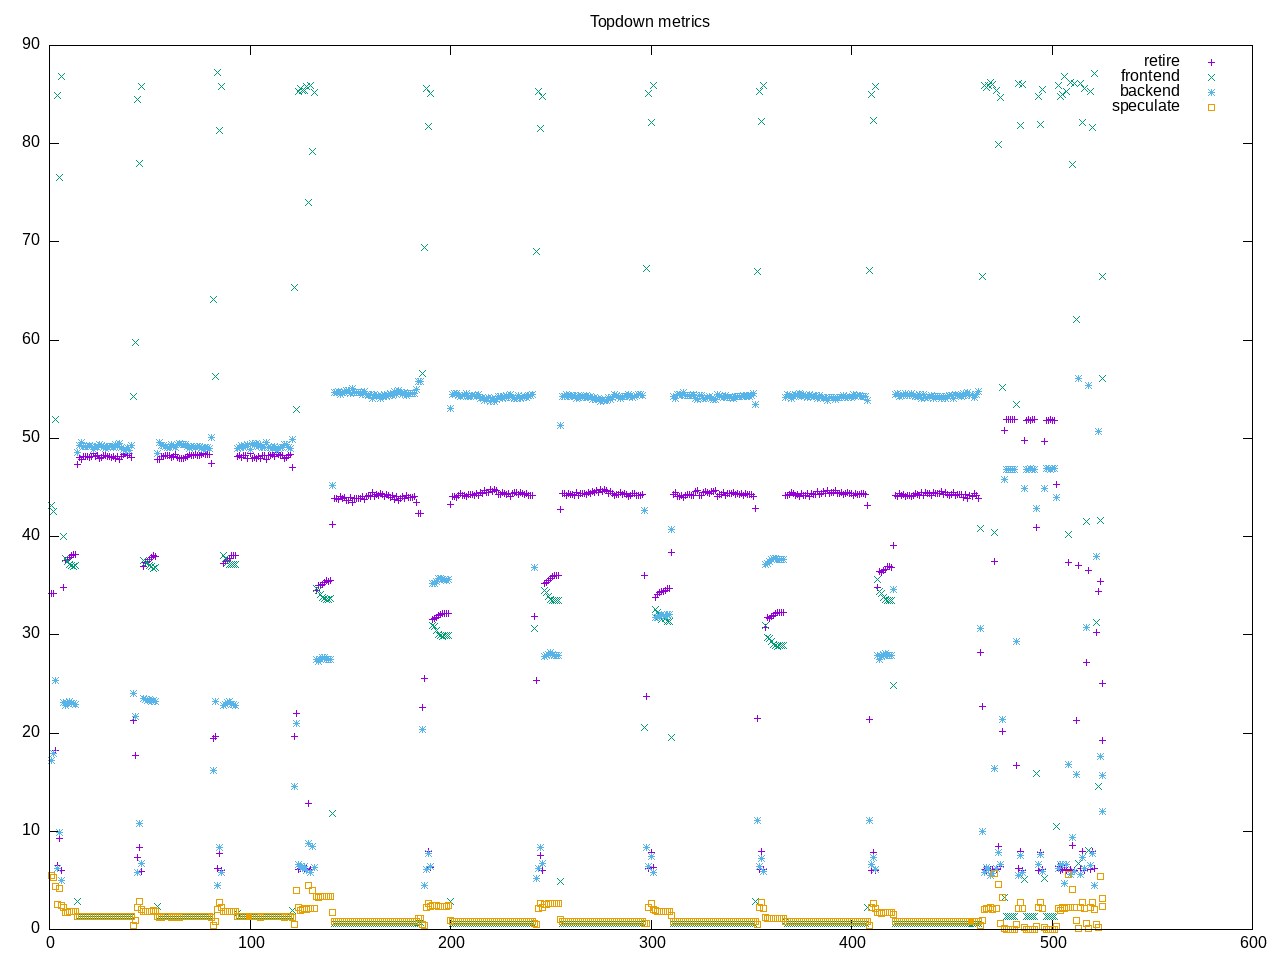
AMD metrics show low frontend stalls. This is floating point code with little L2 access. Most of the backend stalls are CPU-bound.
elapsed              1035.282
on_cpu               0.355          # 5.68 / 16 cores
utime                5785.973
stime                96.720
nvcsw                4591           # 22.08%
nivcsw               16206          # 77.92%
inblock              37784          # 36.50/sec
onblock              35664          # 34.45/sec
cpu-clock            5882831894422  # 5882.832 seconds
task-clock           5882851684544  # 5882.852 seconds
page faults          65455628       # 11126.513/sec
context switches     25671          # 4.364/sec
cpu migrations       5959           # 1.013/sec
major page faults    517            # 0.088/sec
minor page faults    65455111       # 11126.426/sec
alignment faults     0              # 0.000/sec
emulation faults     0              # 0.000/sec
branches             8328733911169  # 128.024 branches per 1000 inst
branch misses        14693691423    # 0.18% branch miss
conditional          5603552654609  # 86.134 conditional branches per 1000 inst
indirect             497478035210   # 7.647 indirect branches per 1000 inst
cpu-cycles           7488943530330  # 1.31 GHz
instructions         19758434866181 # 2.64 IPC
slots                14977782375228 #
retiring             6814177121877  # 45.5% (45.5%)
-- ucode             1365372062     #     0.0%
-- fastpath          6812811749815  #    45.5%
frontend             326471508892   #  2.2% ( 2.2%) low
-- latency           254726563758   #     1.7%
-- bandwidth         71744945134    #     0.5%
backend              7681737582299  # 51.3% (51.3%)
-- cpu               5100495206851  #    34.1%
-- memory            2581242375448  #    17.2%
speculation          149543048615   #  1.0% ( 1.0%) low
-- branch mispredict 124883703377   #     0.8%
-- pipeline restart  24659345238    #     0.2%
smt-contention       5848798338     #  0.0% ( 0.0%)
cpu-cycles           7482994801959  # 1.30 GHz
instructions         19738225800564 # 2.64 IPC
instructions         6588909045206  # 1.178 l2 access per 1000 inst
l2 hit from l1       5322755575     # 10.68% l2 miss
l2 miss from l1      184539829      #
l2 hit from l2 pf    1793129410     #
l3 hit from l2 pf    34443363       #
l3 miss from l2 pf   609523840      #
instructions         6579793505573  # 222.719 float per 1000 inst
float 512            83             # 0.000 AVX-512 per 1000 inst
float 256            946            # 0.000 AVX-256 per 1000 inst
float 128            1465443386798  # 222.719 AVX-128 per 1000 inst
float MMX            0              # 0.000 MMX per 1000 inst
float scalar         0              # 0.000 scalar per 1000 inst
instructions         19748403504221 #
opcache              2905533867944  # 147.128 opcache per 1000 inst
opcache miss         41922370639    #  1.4% opcache miss rate
l1 dTLB miss         234043952      # 0.012 L1 dTLB per 1000 inst
l2 dTLB miss         76014301       # 0.004 L2 dTLB per 1000 inst
instructions         19748634163037 #
icache               76406830087    # 3.869 icache per 1000 inst
icache miss          6662379260     #  8.7% icache miss rate
l1 iTLB miss         27224549       # 0.001 L1 iTLB per 1000 inst
l2 iTLB miss         0              # 0.000 L2 iTLB per 1000 inst
tlb flush            49125          # 0.000 TLB flush per 1000 inst
Intel metrics also show cpu-bound stalls for the backend.
elapsed              1179.262
on_cpu               0.303          # 4.84 / 16 cores
utime                5637.148
stime                73.328
nvcsw                58509          # 80.24%
nivcsw               14404          # 19.76%
inblock              2304912        # 1954.54/sec
onblock              2008           # 1.70/sec
cpu-clock            5710573919435  # 5710.574 seconds
task-clock           5710599096564  # 5710.599 seconds
page faults          68354687       # 11969.793/sec
context switches     78524          # 13.751/sec
cpu migrations       3880           # 0.679/sec
major page faults    55675          # 9.749/sec
minor page faults    68299012       # 11960.043/sec
alignment faults     0              # 0.000/sec
emulation faults     0              # 0.000/sec
branches             6289632555846  # 122.671 branches per 1000 inst
branch misses        4917247843     # 0.08% branch miss
conditional          6289632579782  # 122.671 conditional branches per 1000 inst
indirect             1077480290780  # 21.015 indirect branches per 1000 inst
slots                43206819481880 #
retiring             20365363088824 # 47.1% (47.1%)
-- ucode             1830818416962  #     4.2%
-- fastpath          18534544671862 #    42.9%
frontend             2632266679747  #  6.1% ( 6.1%)
-- latency           1354271430326  #     3.1%
-- bandwidth         1277995249421  #     3.0%
backend              19558375224339 # 45.3% (45.3%)
-- cpu               16552070779783 #    38.3%
-- memory            3006304444556  #     7.0%
speculation          576520337778   #  1.3% ( 1.3%)
-- branch mispredict 392102827742   #     0.9%
-- pipeline restart  184417510036   #     0.4%
smt-contention       0              #  0.0% ( 0.0%)
cpu-cycles           8481833511738  # 1.09 GHz
instructions         23656551048100 # 2.79 IPC
l2 access            9587069567     # 0.665 l2 access per 1000 inst
l2 miss              4576505692     # 47.74% l2 miss
cpu-cycles           5156699832810  # 10.2% memory latency
load stalls          511213801969   #  9.7% l1 bound
l1 miss              12522557086    #  0.1% l2 bound
l2 miss              4800858625     #  0.0% l3 bound
l3 miss              3349985261     #  0.1% dram bound
store_stalls         15141260509    #  0.3% store bound
Process overview shows mostly the bondEngine and repoEngine applications as taking the most time.
608 processes
	 24 bondsEngine.exe       8107.84   102.24
	 24 repoEngine.exe        5418.32   135.04
	201 clinfo                  54.56    21.08
	  9 monteCarloEngin         35.74     0.36
	  9 blackScholesAna          4.11     1.58
	 38 vulkaninfo               1.14     1.71
	  4 vulkani:disk$0           0.12     0.18
	  6 glxinfo:gdrv0            0.12     0.10
	  6 glxinfo:gl0              0.12     0.10
	  6 php                      0.08     0.14
	  2 llvmpipe-0               0.06     0.09
	  2 llvmpipe-1               0.06     0.09
	  2 llvmpipe-10              0.06     0.09
	  2 llvmpipe-11              0.06     0.09
	  2 llvmpipe-12              0.06     0.09
	  2 llvmpipe-13              0.06     0.09
	  2 llvmpipe-14              0.06     0.09
	  2 llvmpipe-15              0.06     0.09
	  2 llvmpipe-2               0.06     0.09
	  2 llvmpipe-3               0.06     0.09
	  2 llvmpipe-4               0.06     0.09
	  2 llvmpipe-5               0.06     0.09
	  2 llvmpipe-6               0.06     0.09
	  2 llvmpipe-7               0.06     0.09
	  2 llvmpipe-8               0.06     0.09
	  2 llvmpipe-9               0.06     0.09
	  2 glxinfo                  0.06     0.04
	  2 glxinfo:cs0              0.06     0.04
	  2 glxinfo:disk$0           0.06     0.04
	  2 glxinfo:sh0              0.06     0.04
	  2 glxinfo:shlo0            0.06     0.04
	  6 clang                    0.04     0.06
	  3 rocminfo                 0.00     0.03
	  1 lspci                    0.00     0.03
	 92 sh                       0.00     0.00
	 24 financebench             0.00     0.00
	 13 dirname                  0.00     0.00
	 13 gcc                      0.00     0.00
	 12 basename                 0.00     0.00
	  9 gsettings                0.00     0.00
	  8 stat                     0.00     0.00
	  8 systemd-detect-          0.00     0.00
	  6 llvm-link                0.00     0.00
	  5 phoronix-test-s          0.00     0.00
	  4 gmain                    0.00     0.00
	  3 dconf worker             0.00     0.00
	  2 cc                       0.00     0.00
	  2 lscpu                    0.00     0.00
	  2 uname                    0.00     0.00
	  2 which                    0.00     0.00
	  2 xset                     0.00     0.00
	  1 date                     0.00     0.00
	  1 dmesg                    0.00     0.00
	  1 dmidecode                0.00     0.00
	  1 grep                     0.00     0.00
	  1 ifconfig                 0.00     0.00
	  1 ip                       0.00     0.00
	  1 lsmod                    0.00     0.00
	  1 mktemp                   0.00     0.00
	  1 ps                       0.00     0.00
	  1 qdbus                    0.00     0.00
	  1 readlink                 0.00     0.00
	  1 realpath                 0.00     0.00
	  1 sed                      0.00     0.00
	  1 sort                     0.00     0.00
	  1 stty                     0.00     0.00
	  1 systemctl                0.00     0.00
	  1 template.sh              0.00     0.00
	  1 wc                       0.00     0.00
	  1 xrandr                   0.00     0.00
0 processes running
47 maximum processes
Computation blocks
      950098) financebench     cpu=14 start=6.49  finish=42.64
        950099) dirname          cpu=4 start=6.49  finish=6.49
        950100) financebench     cpu=15 start=6.49  finish=6.49
        950101) repoEngine.exe   cpu=2 start=6.49  finish=42.64
          950102) basename         cpu=4 start=6.49  finish=6.49
          950105) repoEngine.exe   cpu=11 start=13.65 finish=42.64
          950106) repoEngine.exe   cpu=4 start=13.65 finish=42.64
          950107) repoEngine.exe   cpu=13 start=13.65 finish=42.64
          950108) repoEngine.exe   cpu=6 start=13.65 finish=42.64
          950109) repoEngine.exe   cpu=15 start=13.65 finish=42.64
          950110) repoEngine.exe   cpu=1 start=13.65 finish=42.64
          950111) repoEngine.exe   cpu=0 start=13.65 finish=42.64