
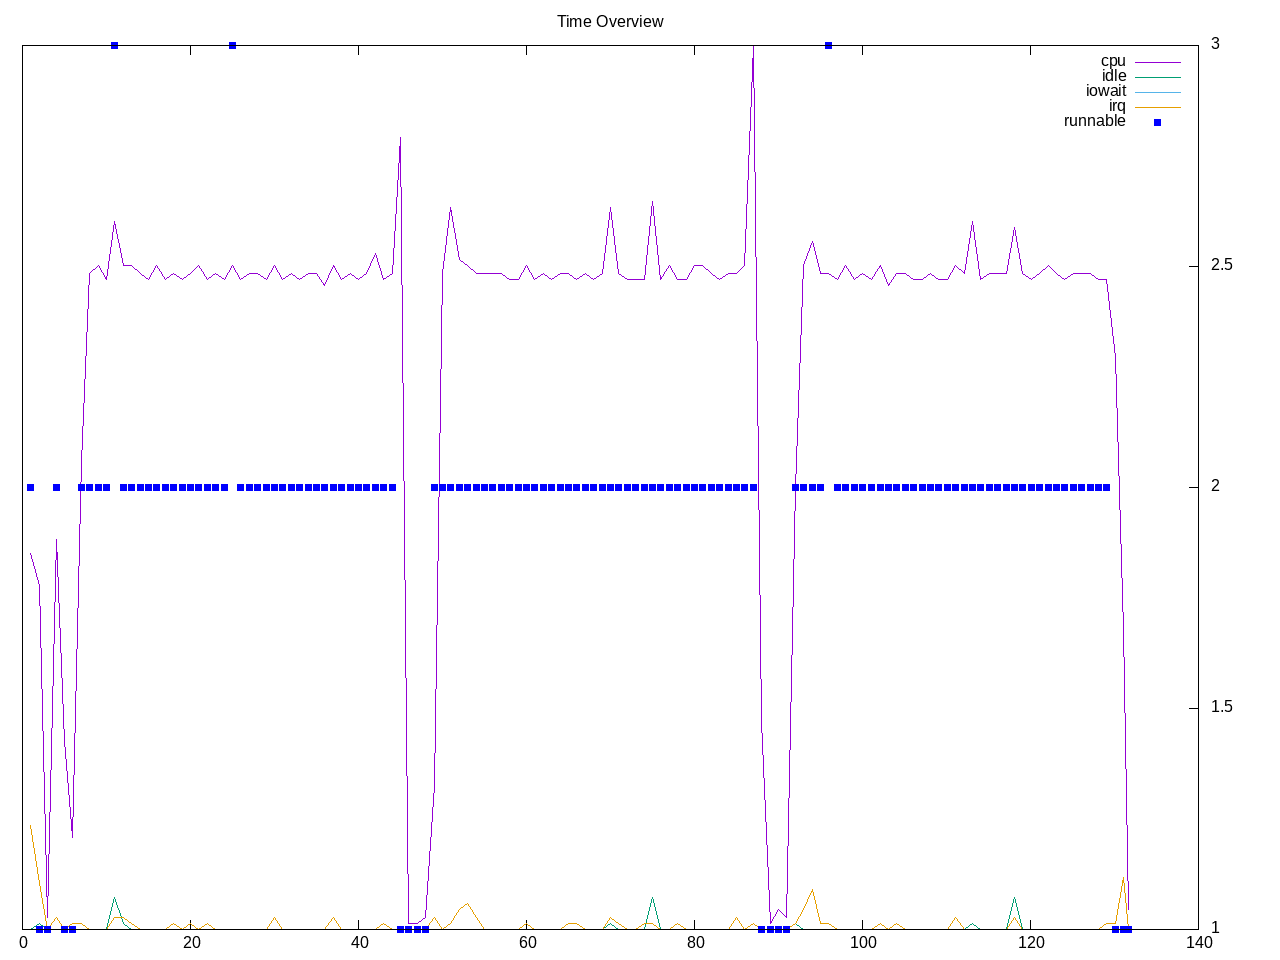
Static git operations on the Gnome GTK tool-kit repository. There is one test that runs in less than a minute. The test looks to be single-threaded.
Topdown profile shows a higher amount of branch mis-prediction.
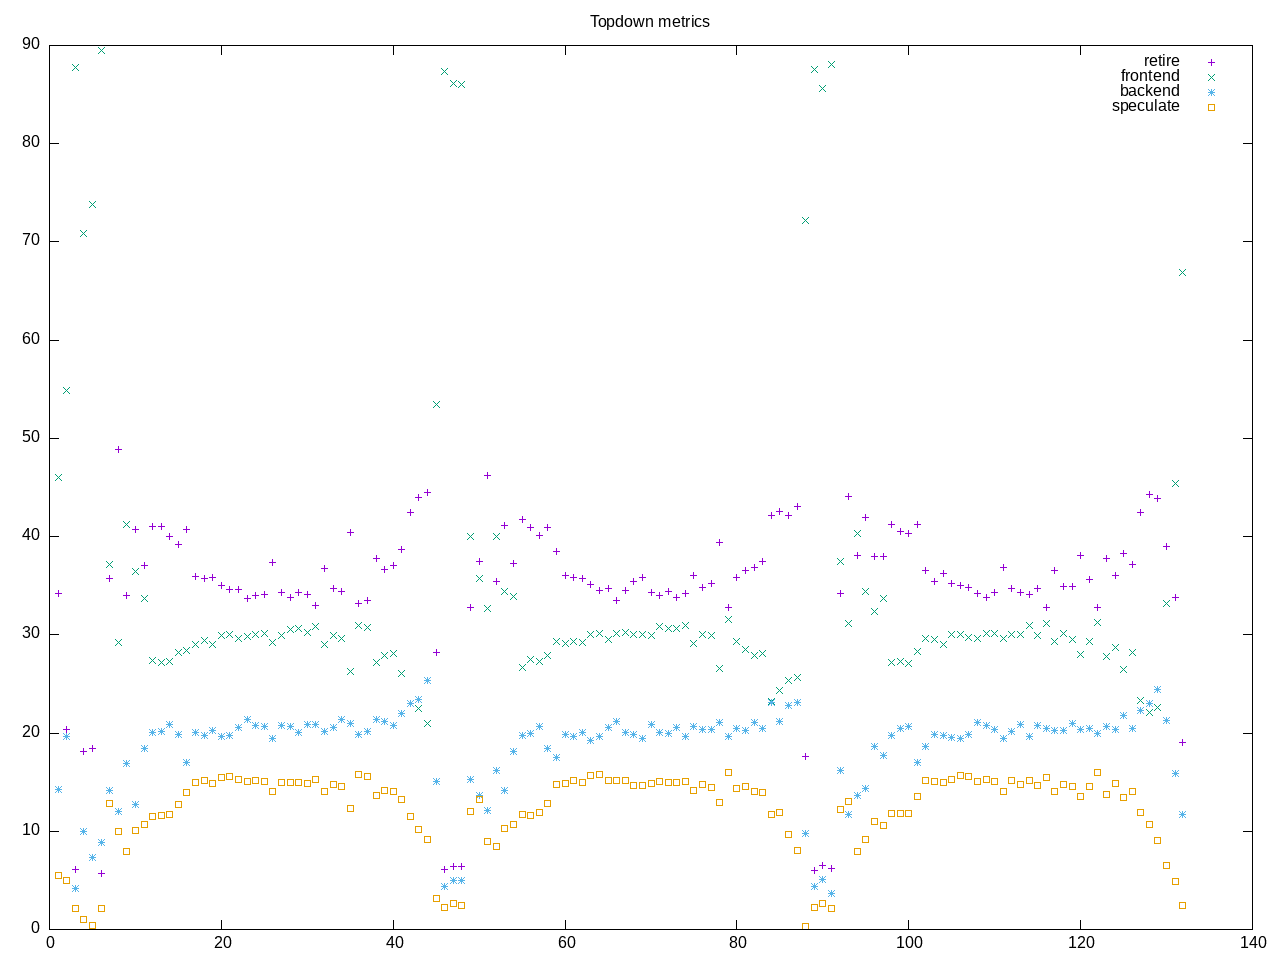
AMD metrics show little floating point and not much L2 activity. The opcache miss rate is low.
elapsed              131.796
on_cpu               0.057          # 0.91 / 16 cores
utime                112.253
stime                7.422
nvcsw                47968          # 97.55%
nivcsw               1207           # 2.45%
inblock              0              # 0.00/sec
onblock              3607424        # 27371.36/sec
cpu-clock            119667693734   # 119.668 seconds
task-clock           119704040224   # 119.704 seconds
page faults          1984347        # 16577.110/sec
context switches     49597          # 414.330/sec
cpu migrations       804            # 6.717/sec
major page faults    5              # 0.042/sec
minor page faults    1984342        # 16577.068/sec
alignment faults     0              # 0.000/sec
emulation faults     0              # 0.000/sec
branches             235222962408   # 177.479 branches per 1000 inst
branch misses        8196065833     # 3.48% branch miss
conditional          205496270282   # 155.050 conditional branches per 1000 inst
indirect             2650864251     # 2.000 indirect branches per 1000 inst
cpu-cycles           546385786951   # 0.26 GHz
instructions         1324592611227  # 2.42 IPC
slots                1100081784528  #
retiring             405260310962   # 36.8% (36.9%)
-- ucode             143677763      #     0.0%
-- fastpath          405116633199   #    36.8%
frontend             332143853033   # 30.2% (30.3%)
-- latency           190794876906   #    17.3%
-- bandwidth         141348976127   #    12.8%
backend              215900183476   # 19.6% (19.7%)
-- cpu               42674006107    #     3.9%
-- memory            173226177369   #    15.7%
speculation          143903238808   # 13.1% (13.1%) high
-- branch mispredict 143502363445   #    13.0%
-- pipeline restart  400875363      #     0.0%
smt-contention       2873318285     #  0.3% ( 0.0%)
cpu-cycles           544251653091   # 0.25 GHz
instructions         1322152825803  # 2.43 IPC
instructions         443435340050   # 19.177 l2 access per 1000 inst
l2 hit from l1       5295834666     # 26.43% l2 miss
l2 miss from l1      544871939      #
l2 hit from l2 pf    1505236510     #
l3 hit from l2 pf    1205993772     #
l3 miss from l2 pf   496625248      #
instructions         441542185448   # 5.639 float per 1000 inst
float 512            68             # 0.000 AVX-512 per 1000 inst
float 256            928            # 0.000 AVX-256 per 1000 inst
float 128            2489794488     # 5.639 AVX-128 per 1000 inst
float MMX            0              # 0.000 MMX per 1000 inst
float scalar         0              # 0.000 scalar per 1000 inst
instructions         1326160588377  #
opcache              305502087387   # 230.366 opcache per 1000 inst
opcache miss         8123047661     #  2.7% opcache miss rate
l1 dTLB miss         1060294462     # 0.800 L1 dTLB per 1000 inst
l2 dTLB miss         101316249      # 0.076 L2 dTLB per 1000 inst
instructions         1327860259496  #
icache               16324891615    # 12.294 icache per 1000 inst
icache miss          2325560685     # 14.2% icache miss rate
l1 iTLB miss         61416665       # 0.046 L1 iTLB per 1000 inst
l2 iTLB miss         0              # 0.000 L2 iTLB per 1000 inst
tlb flush            100325         # 0.000 TLB flush per 1000 inst
Intel metrics
elapsed              164.491
on_cpu               0.057          # 0.92 / 16 cores
utime                146.579
stime                4.725
nvcsw                48888          # 96.51%
nivcsw               1766           # 3.49%
inblock              472            # 2.87/sec
onblock              3596160        # 21862.33/sec
cpu-clock            150883248946   # 150.883 seconds
task-clock           150922653465   # 150.923 seconds
page faults          1809077        # 11986.782/sec
context switches     51242          # 339.525/sec
cpu migrations       1974           # 13.080/sec
major page faults    8              # 0.053/sec
minor page faults    1809069        # 11986.729/sec
alignment faults     0              # 0.000/sec
emulation faults     0              # 0.000/sec
branches             234648916955   # 176.744 branches per 1000 inst
branch misses        7833700980     # 3.34% branch miss
conditional          234648938299   # 176.744 conditional branches per 1000 inst
indirect             3129201772     # 2.357 indirect branches per 1000 inst
slots                3387615982166  #
retiring             1224686147984  # 36.2% (36.2%)
-- ucode             63651837000    #     1.9%
-- fastpath          1161034310984  #    34.3%
frontend             752027801342   # 22.2% (22.2%)
-- latency           267936226727   #     7.9%
-- bandwidth         484091574615   #    14.3%
backend              505710887104   # 14.9% (14.9%) low
-- cpu               283034548949   #     8.4%
-- memory            222676338155   #     6.6%
speculation          910116339086   # 26.9% (26.9%) high
-- branch mispredict 900602621886   #    26.6%
-- pipeline restart  9513717200     #     0.3%
smt-contention       0              #  0.0% ( 0.0%)
cpu-cycles           568774584615   # 0.22 GHz
instructions         1325039777825  # 2.33 IPC
l2 access            23579100188    # 17.886 l2 access per 1000 inst
l2 miss              9316851559     # 39.51% l2 miss
cpu-cycles           566495925915   # 15.2% memory latency
load stalls          79622841783    #  5.0% l1 bound
l1 miss              51403989333    #  5.9% l2 bound
l2 miss              17824816622    #  1.8% l3 bound
l3 miss              7616033591     #  1.3% dram bound
store_stalls         6305559124     #  1.1% store bound
Process overview shows many short git processes. Also looks like we lost track of a few.
669 processes
	313 git                    129.26     6.13
	 68 clinfo                  16.96     5.32
	 38 vulkaninfo               1.31     1.14
	  6 php                      0.14     0.60
	  4 vulkani:disk$0           0.13     0.12
	  2 llvmpipe-0               0.07     0.06
	  2 llvmpipe-1               0.07     0.06
	  2 llvmpipe-10              0.07     0.06
	  2 llvmpipe-11              0.07     0.06
	  2 llvmpipe-12              0.07     0.06
	  2 llvmpipe-13              0.07     0.06
	  2 llvmpipe-14              0.07     0.06
	  2 llvmpipe-15              0.07     0.06
	  2 llvmpipe-2               0.07     0.06
	  2 llvmpipe-3               0.07     0.06
	  2 llvmpipe-4               0.07     0.06
	  2 llvmpipe-5               0.07     0.06
	  2 llvmpipe-6               0.07     0.06
	  2 llvmpipe-7               0.07     0.06
	  2 llvmpipe-8               0.07     0.06
	  2 llvmpipe-9               0.07     0.06
	  3 cp                       0.05     1.68
	  6 clang                    0.04     0.06
	  3 rocminfo                 0.03     0.00
	  4 rm                       0.00     0.39
	  1 lspci                    0.00     0.02
	  1 ps                       0.00     0.01
	 86 sh                       0.00     0.00
	 12 gcc                      0.00     0.00
	 11 gsettings                0.00     0.00
	  8 stat                     0.00     0.00
	  8 systemd-detect-          0.00     0.00
	  6 llvm-link                0.00     0.00
	  5 phoronix-test-s          0.00     0.00
	  4 bash                     0.00     0.00
	  4 glxinfo                  0.00     0.00
	  3 gmain                    0.00     0.00
	  3 mv                       0.00     0.00
	  2 dconf worker             0.00     0.00
	  2 lscpu                    0.00     0.00
	  2 setterm                  0.00     0.00
	  2 uname                    0.00     0.00
	  2 which                    0.00     0.00
	  1 cc                       0.00     0.00
	  1 date                     0.00     0.00
	  1 dirname                  0.00     0.00
	  1 dmesg                    0.00     0.00
	  1 dmidecode                0.00     0.00
	  1 grep                     0.00     0.00
	  1 ifconfig                 0.00     0.00
	  1 ip                       0.00     0.00
	  1 lsmod                    0.00     0.00
	  1 mktemp                   0.00     0.00
	  1 qdbus                    0.00     0.00
	  1 readlink                 0.00     0.00
	  1 realpath                 0.00     0.00
	  1 sed                      0.00     0.00
	  1 sort                     0.00     0.00
	  1 stty                     0.00     0.00
	  1 systemctl                0.00     0.00
	  1 template.sh              0.00     0.00
	  1 wc                       0.00     0.00
11 processes running
58 maximum processes