
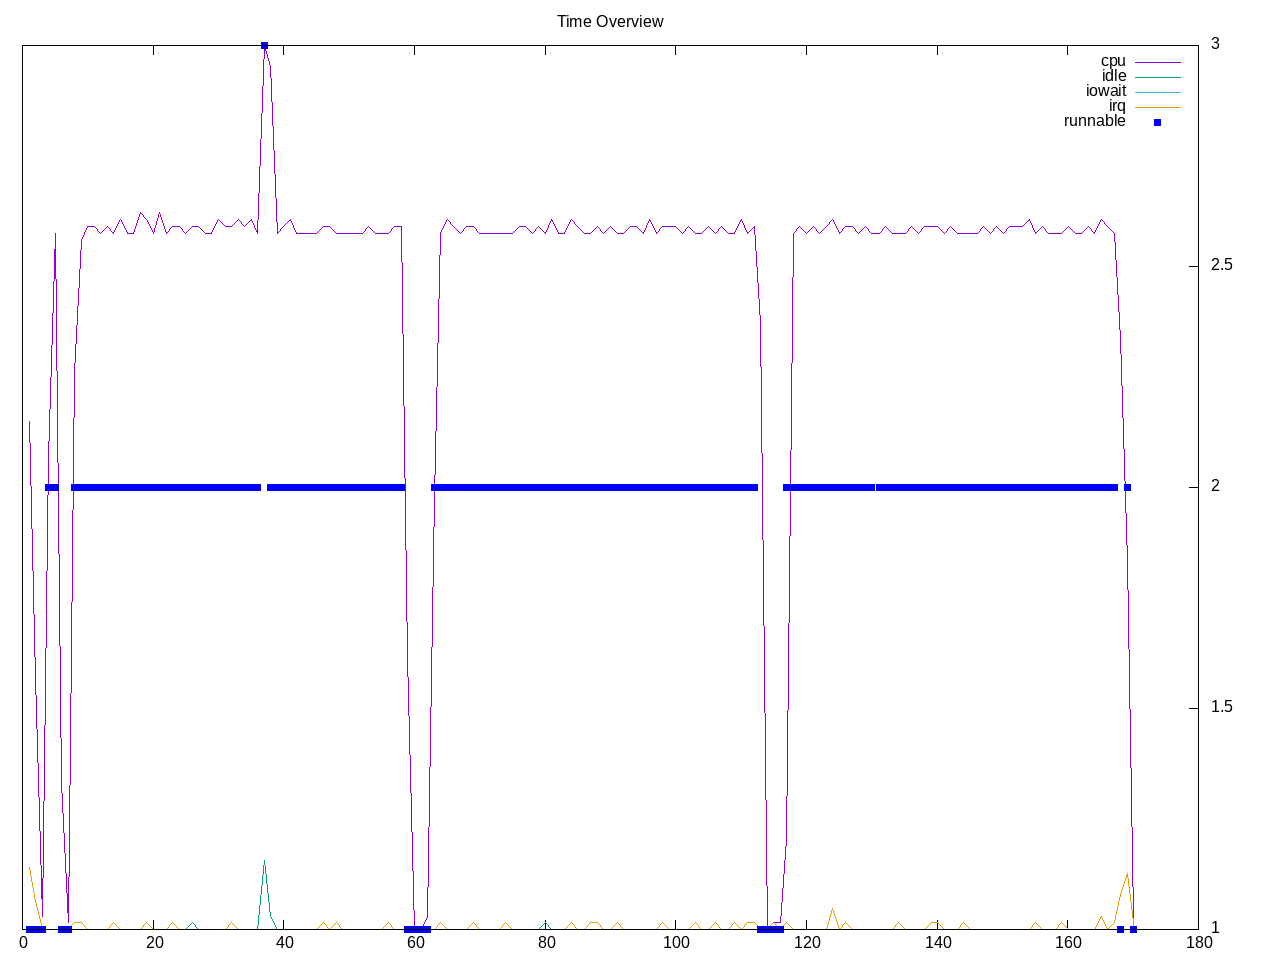
Test to encrypt a 2.7GB file with GnuPG. Looks like a single-threaded program that runs in about a minute.
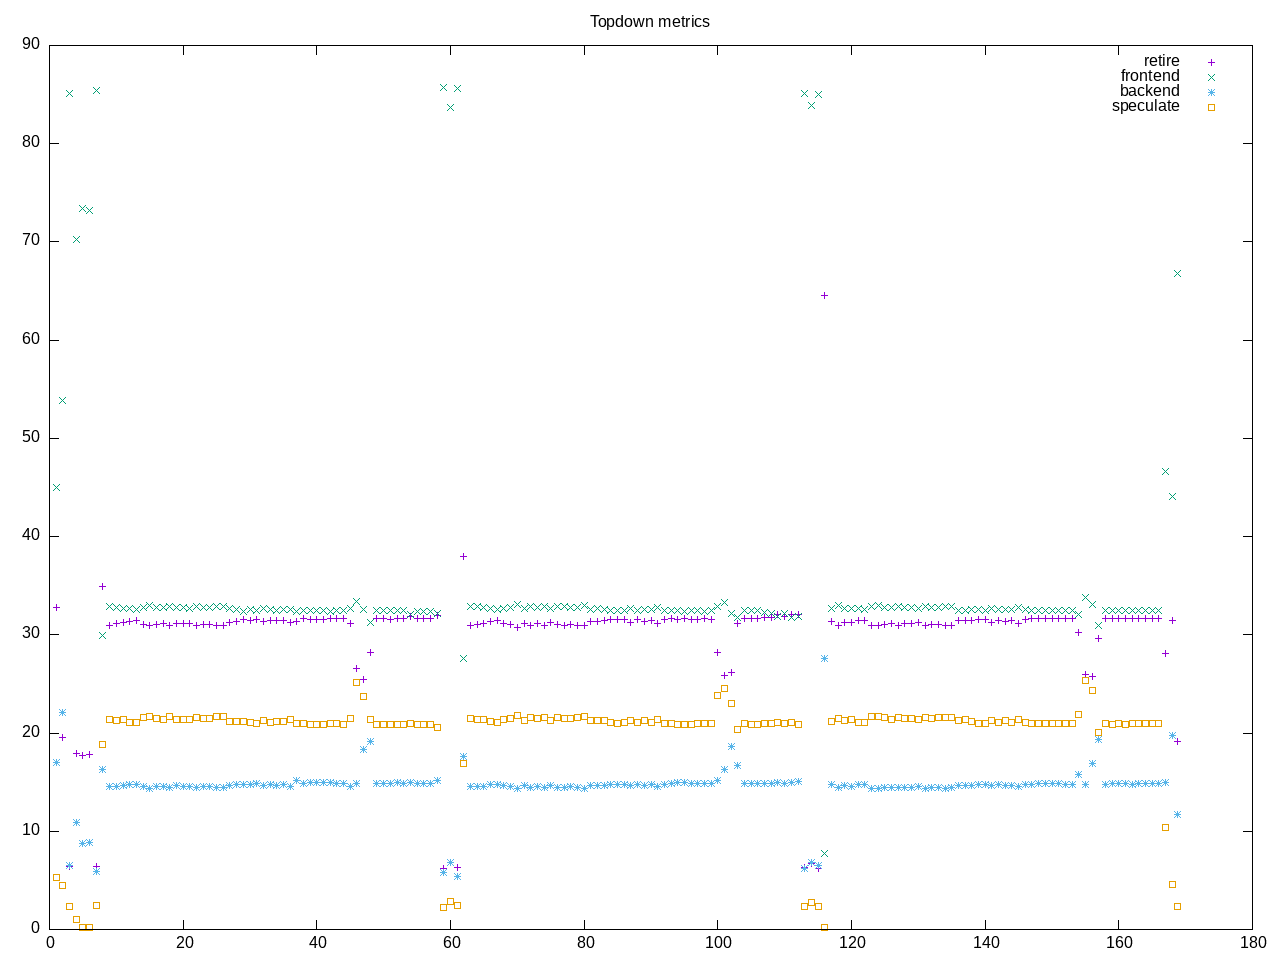
Topdown profile shows speculation stalls as particularly high and backend stalls as low.
AMD metrics confirm a single-threaded program. Little floating point and little L2 access. Not many indirect branches but still very high branch mis-prediction. Frontend stalls are more latency than bandwidth
elapsed              169.011
on_cpu               0.057          # 0.92 / 16 cores
utime                151.248
stime                3.799
nvcsw                2031           # 72.85%
nivcsw               757            # 27.15%
inblock              0              # 0.00/sec
onblock              4207744        # 24896.30/sec
cpu-clock            155083495851   # 155.083 seconds
task-clock           155087202998   # 155.087 seconds
page faults          148931         # 960.305/sec
context switches     3455           # 22.278/sec
cpu migrations       256            # 1.651/sec
major page faults    2              # 0.013/sec
minor page faults    148929         # 960.292/sec
alignment faults     0              # 0.000/sec
emulation faults     0              # 0.000/sec
branches             204801389499   # 146.104 branches per 1000 inst
branch misses        14376986247    # 7.02% branch miss
conditional          191213671302   # 136.411 conditional branches per 1000 inst
indirect             142014949      # 0.101 indirect branches per 1000 inst
cpu-cycles           715665699465   # 0.27 GHz
instructions         1400096299132  # 1.96 IPC
slots                1434267036432  #
retiring             445645996834   # 31.1% (31.1%)
-- ucode             47579507       #     0.0%
-- fastpath          445598417327   #    31.1%
frontend             473772218359   # 33.0% (33.0%)
-- latency           248750339964   #    17.3%
-- bandwidth         225021878395   #    15.7%
backend              214028036606   # 14.9% (14.9%) low
-- cpu               63033651425    #     4.4%
-- memory            150994385181   #    10.5%
speculation          300713825870   # 21.0% (21.0%) high
-- branch mispredict 300208618021   #    20.9%
-- pipeline restart  505207849      #     0.0%
smt-contention       106654498      #  0.0% ( 0.0%)
cpu-cycles           718195890990   # 0.27 GHz
instructions         1400152976411  # 1.95 IPC
instructions         467215406957   # 17.124 l2 access per 1000 inst
l2 hit from l1       4745977338     # 1.02% l2 miss
l2 miss from l1      31050704       #
l2 hit from l2 pf    3203773986     #
l3 hit from l2 pf    17341357       #
l3 miss from l2 pf   33443160       #
instructions         467198274463   # 23.010 float per 1000 inst
float 512            43             # 0.000 AVX-512 per 1000 inst
float 256            654            # 0.000 AVX-256 per 1000 inst
float 128            10750115468    # 23.010 AVX-128 per 1000 inst
float MMX            0              # 0.000 MMX per 1000 inst
float scalar         0              # 0.000 scalar per 1000 inst
Intel metrics
elapsed              205.884
on_cpu               0.058          # 0.93 / 16 cores
utime                189.745
stime                2.491
nvcsw                1952           # 70.17%
nivcsw               830            # 29.83%
inblock              0              # 0.00/sec
onblock              4196488        # 20382.77/sec
cpu-clock            192257964300   # 192.258 seconds
task-clock           192261256286   # 192.261 seconds
page faults          138112         # 718.356/sec
context switches     3632           # 18.891/sec
cpu migrations       281            # 1.462/sec
major page faults    0              # 0.000/sec
minor page faults    138112         # 718.356/sec
alignment faults     0              # 0.000/sec
emulation faults     0              # 0.000/sec
branches             203656765790   # 145.850 branches per 1000 inst
branch misses        14459480379    # 7.10% branch miss
conditional          203656778046   # 145.850 conditional branches per 1000 inst
indirect             146325163      # 0.105 indirect branches per 1000 inst
slots                4363710725378  #
retiring             1314816821795  # 30.1% (30.1%)
-- ucode             86447683819    #     2.0%
-- fastpath          1228369137976  #    28.1%
frontend             819185548728   # 18.8% (18.8%)
-- latency           377630877144   #     8.7%
-- bandwidth         441554671584   #    10.1%
backend              510111406692   # 11.7% (11.7%) low
-- cpu               416279869681   #     9.5%
-- memory            93831537011    #     2.2%
speculation          1725289697089  # 39.5% (39.5%) high
-- branch mispredict 1713750484505  #    39.3%
-- pipeline restart  11539212584    #     0.3%
smt-contention       0              #  0.0% ( 0.0%)
cpu-cycles           727399626683   # 0.22 GHz
instructions         1396330348949  # 1.92 IPC
l2 access            11452117161    # 8.202 l2 access per 1000 inst
l2 miss              432509657      # 3.78% l2 miss
Process overview shows the gpg process and rest is test system overhead.
363 processes
	  3 gpg                    149.76     1.32
	 68 clinfo                  17.20     5.72
	 38 vulkaninfo               0.95     1.33
	  6 glxinfo:gdrv0            0.15     0.04
	  6 glxinfo:gl0              0.15     0.04
	  4 vulkani:disk$0           0.10     0.14
	  6 clang                    0.08     0.04
	  2 glxinfo                  0.07     0.02
	  2 glxinfo:cs0              0.07     0.02
	  2 glxinfo:disk$0           0.07     0.02
	  2 glxinfo:sh0              0.07     0.02
	  2 glxinfo:shlo0            0.07     0.02
	  6 php                      0.05     0.08
	  2 llvmpipe-0               0.05     0.07
	  2 llvmpipe-1               0.05     0.07
	  2 llvmpipe-10              0.05     0.07
	  2 llvmpipe-11              0.05     0.07
	  2 llvmpipe-12              0.05     0.07
	  2 llvmpipe-13              0.05     0.07
	  2 llvmpipe-14              0.05     0.07
	  2 llvmpipe-15              0.05     0.07
	  2 llvmpipe-2               0.05     0.07
	  2 llvmpipe-3               0.05     0.07
	  2 llvmpipe-4               0.05     0.07
	  2 llvmpipe-5               0.05     0.07
	  2 llvmpipe-6               0.05     0.07
	  2 llvmpipe-7               0.05     0.07
	  2 llvmpipe-8               0.05     0.07
	  2 llvmpipe-9               0.05     0.07
	  3 rocminfo                 0.03     0.00
	  1 dd                       0.00     1.72
	  1 rm                       0.00     0.25
	  1 lspci                    0.00     0.02
	 84 sh                       0.00     0.00
	 13 gcc                      0.00     0.00
	  9 gsettings                0.00     0.00
	  8 stat                     0.00     0.00
	  8 systemd-detect-          0.00     0.00
	  6 gnupg                    0.00     0.00
	  6 llvm-link                0.00     0.00
	  5 phoronix-test-s          0.00     0.00
	  4 gmain                    0.00     0.00
	  3 dconf worker             0.00     0.00
	  2 bash                     0.00     0.00
	  2 cc                       0.00     0.00
	  2 lscpu                    0.00     0.00
	  2 uname                    0.00     0.00
	  2 which                    0.00     0.00
	  2 xset                     0.00     0.00
	  1 date                     0.00     0.00
	  1 dirname                  0.00     0.00
	  1 dmesg                    0.00     0.00
	  1 dmidecode                0.00     0.00
	  1 grep                     0.00     0.00
	  1 ifconfig                 0.00     0.00
	  1 ip                       0.00     0.00
	  1 lsmod                    0.00     0.00
	  1 mktemp                   0.00     0.00
	  1 ps                       0.00     0.00
	  1 qdbus                    0.00     0.00
	  1 readlink                 0.00     0.00
	  1 realpath                 0.00     0.00
	  1 sed                      0.00     0.00
	  1 sort                     0.00     0.00
	  1 stty                     0.00     0.00
	  1 systemctl                0.00     0.00
	  1 template.sh              0.00     0.00
	  1 wc                       0.00     0.00
	  1 xrandr                   0.00     0.00
0 processes running
47 maximum processes
The core computation sections
      1173365) gnupg            cpu=4 start=7.23  finish=57.56
        1173366) gnupg            cpu=5 start=7.24  finish=7.24
        1173367) gpg              cpu=14 start=7.24  finish=57.56
      1173372) gnupg            cpu=13 start=61.57 finish=111.85
        1173373) gnupg            cpu=14 start=61.57 finish=61.57
        1173374) gpg              cpu=8 start=61.57 finish=111.85
      1173376) gnupg            cpu=4 start=115.86 finish=166.37
        1173377) gnupg            cpu=5 start=115.86 finish=115.86
        1173378) gpg              cpu=14 start=115.86 finish=166.37