
Density functional theory (DFT) Python code using the projector-augmented wave (PAW) method for an atomic simulation. There is one workload. This runs on half the threads, one per non-hyperthreaded core.
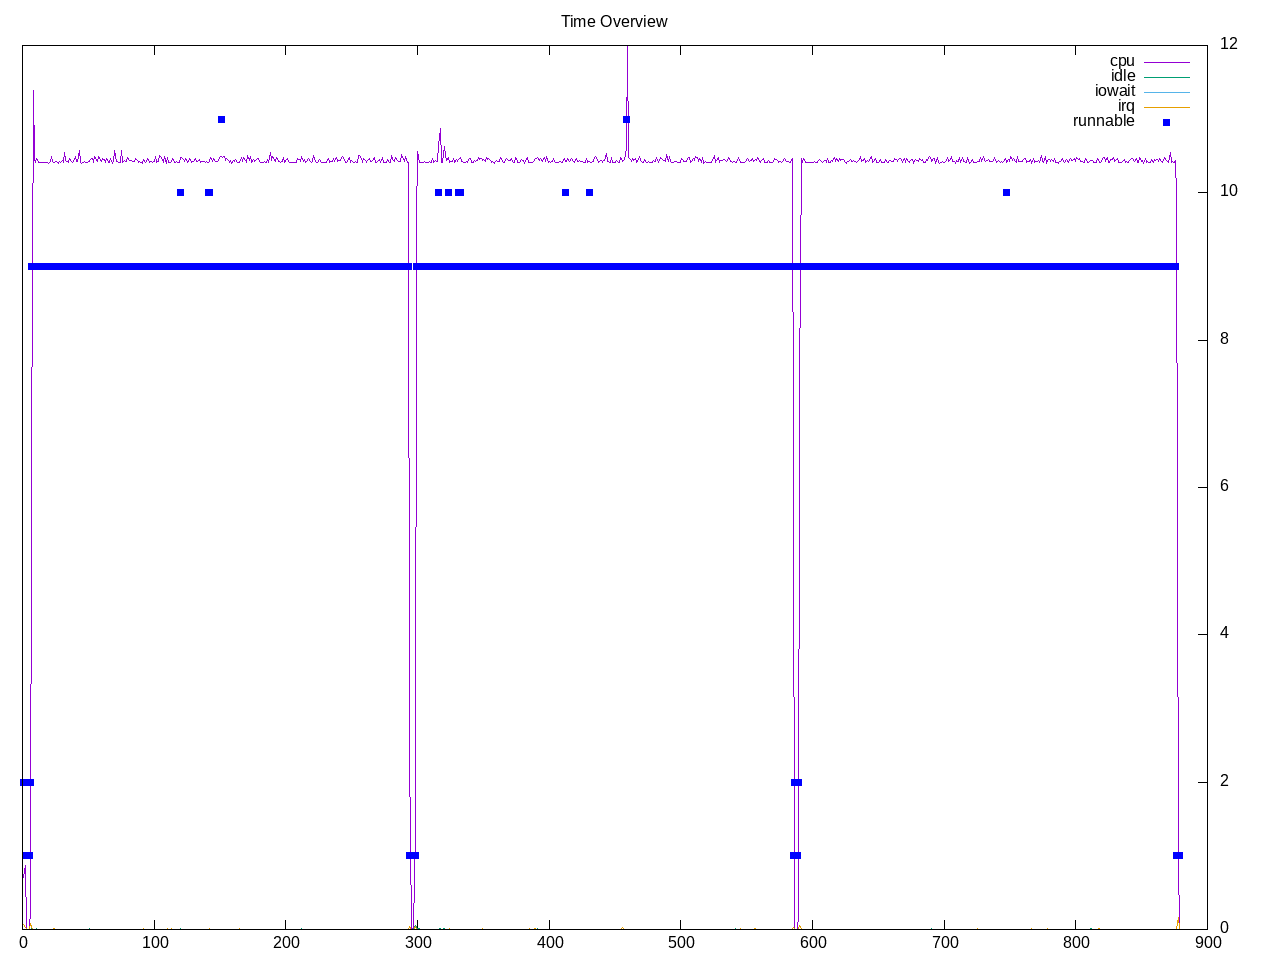
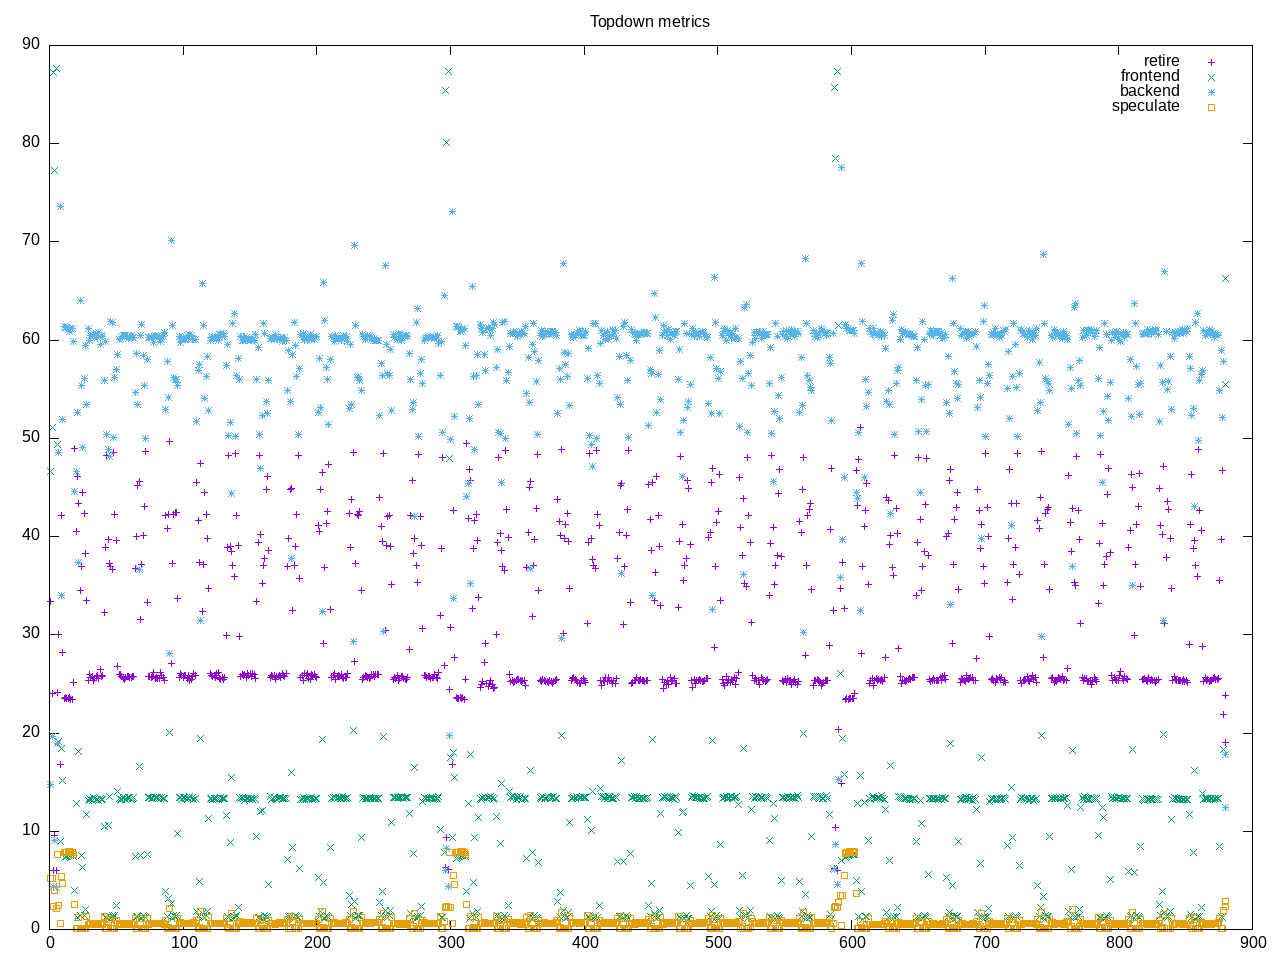
Topdown profile shows higher level of backend stalls with a retirement rate of ~25%
AMD metrics show moderate amount of floating point code and some L2 misses.
elapsed              879.790
on_cpu               0.489          # 7.83 / 16 cores
utime                6817.162
stime                73.081
nvcsw                36307          # 68.18%
nivcsw               16948          # 31.82%
inblock              1288           # 1.46/sec
onblock              63168          # 71.80/sec
cpu-clock            6890744986177  # 6890.745 seconds
task-clock           6890812005155  # 6890.812 seconds
page faults          2689926        # 390.364/sec
context switches     57455          # 8.338/sec
cpu migrations       10220          # 1.483/sec
major page faults    454            # 0.066/sec
minor page faults    2689472        # 390.298/sec
alignment faults     0              # 0.000/sec
emulation faults     0              # 0.000/sec
branches             5067382619636  # 88.637 branches per 1000 inst
branch misses        21956030233    # 0.43% branch miss
conditional          4570353532552  # 79.943 conditional branches per 1000 inst
indirect             96880742006    # 1.695 indirect branches per 1000 inst
cpu-cycles           28645796778898 # 2.03 GHz
instructions         57307273149574 # 2.00 IPC
slots                57301193688450 #
retiring             18074275342804 # 31.5% (31.6%)
-- ucode             4569462167     #     0.0%
-- fastpath          18069705880637 #    31.5%
frontend             5577092011479  #  9.7% ( 9.7%)
-- latency           1689665033616  #     2.9%
-- bandwidth         3887426977863  #     6.8%
backend              33176548791633 # 57.9% (57.9%)
-- cpu               7819262233119  #    13.6%
-- memory            25357286558514 #    44.3%
speculation          450755148897   #  0.8% ( 0.8%) low
-- branch mispredict 427854179817   #     0.7%
-- pipeline restart  22900969080    #     0.0%
smt-contention       22505648420    #  0.0% ( 0.0%)
cpu-cycles           28658532272169 # 2.03 GHz
instructions         57400761976266 # 2.00 IPC
instructions         19129140187890 # 41.908 l2 access per 1000 inst
l2 hit from l1       455236816481   # 21.61% l2 miss
l2 miss from l1      27900360554    #
l2 hit from l2 pf    201075435807   #
l3 hit from l2 pf    67459643835    #
l3 miss from l2 pf   77893717347    #
instructions         19136457221452 # 86.698 float per 1000 inst
float 512            58             # 0.000 AVX-512 per 1000 inst
float 256            7550759        # 0.000 AVX-256 per 1000 inst
float 128            1659094467361  # 86.698 AVX-128 per 1000 inst
float MMX            0              # 0.000 MMX per 1000 inst
float scalar         290            # 0.000 scalar per 1000 inst
instructions         57209474789614 #
opcache              8398454124632  # 146.802 opcache per 1000 inst
opcache miss         95647728925    #  1.1% opcache miss rate
l1 dTLB miss         27140697084    # 0.474 L1 dTLB per 1000 inst
l2 dTLB miss         675797055      # 0.012 L2 dTLB per 1000 inst
instructions         56987401832589 #
icache               152362894146   # 2.674 icache per 1000 inst
icache miss          40512482340    # 26.6% icache miss rate
l1 iTLB miss         2868021287     # 0.050 L1 iTLB per 1000 inst
l2 iTLB miss         0              # 0.000 L2 iTLB per 1000 inst
tlb flush            91117          # 0.000 TLB flush per 1000 inst
Intel metrics show some L2 stalls as well at dram
elapsed              1652.916
on_cpu               0.742          # 11.87 / 16 cores
utime                19511.614
stime                104.588
nvcsw                62814          # 61.27%
nivcsw               39708          # 38.73%
inblock              57208          # 34.61/sec
onblock              51880          # 31.39/sec
cpu-clock            19616663802704 # 19616.664 seconds
task-clock           19616720866028 # 19616.721 seconds
page faults          2343849        # 119.482/sec
context switches     110562         # 5.636/sec
cpu migrations       12467          # 0.636/sec
major page faults    1055           # 0.054/sec
minor page faults    2342794        # 119.428/sec
alignment faults     0              # 0.000/sec
emulation faults     0              # 0.000/sec
branches             12046494816063 # 85.081 branches per 1000 inst
branch misses        35635764744    # 0.30% branch miss
conditional          12046494831071 # 85.081 conditional branches per 1000 inst
indirect             2827703316046  # 19.971 indirect branches per 1000 inst
slots                116572969610660 #
retiring             72209870930905 # 61.9% (61.9%) high
-- ucode             3323646371248  #     2.9%
-- fastpath          68886224559657 #    59.1%
frontend             8583540422122  #  7.4% ( 7.4%)
-- latency           3414647768949  #     2.9%
-- bandwidth         5168892653173  #     4.4%
backend              29797674212233 # 25.6% (25.6%)
-- cpu               13703383213043 #    11.8%
-- memory            16094290999190 #    13.8%
speculation          6757381760784  #  5.8% ( 5.8%)
-- branch mispredict 6310528243422  #     5.4%
-- pipeline restart  446853517362   #     0.4%
smt-contention       0              #  0.0% ( 0.0%)
cpu-cycles           56388787765085 # 2.13 GHz
instructions         214541993236726 # 3.80 IPC high
l2 access            955320349641   # 12.984 l2 access per 1000 inst
l2 miss              180229145145   # 18.87% l2 miss
cpu-cycles           19388196618177 # 19.7% memory latency
load stalls          3472088794438  #  0.0% l1 bound
l1 miss              4326972554796  # 11.4% l2 bound
l2 miss              2116470705514  #  2.3% l3 bound
l3 miss              1675077840237  #  8.6% dram bound
store_stalls         345715962901   #  1.8% store bound
Process overview shows this as python code run under MPI
433 processes
	 73 python3              20507.82   206.30
	 68 clinfo                  16.52     6.01
	 38 vulkaninfo               1.49     1.03
	 18 mpirun                   1.05     2.22
	  4 vulkani:disk$0           0.15     0.11
	  2 llvmpipe-0               0.08     0.06
	  2 llvmpipe-1               0.08     0.06
	  2 llvmpipe-10              0.08     0.06
	  2 llvmpipe-11              0.08     0.06
	  2 llvmpipe-12              0.08     0.06
	  2 llvmpipe-13              0.08     0.06
	  2 llvmpipe-14              0.08     0.06
	  2 llvmpipe-15              0.08     0.06
	  2 llvmpipe-2               0.08     0.06
	  2 llvmpipe-3               0.08     0.06
	  2 llvmpipe-4               0.08     0.06
	  2 llvmpipe-5               0.08     0.06
	  2 llvmpipe-6               0.08     0.06
	  2 llvmpipe-7               0.08     0.06
	  2 llvmpipe-8               0.08     0.06
	  2 llvmpipe-9               0.08     0.06
	  6 php                      0.06     0.56
	  6 clang                    0.05     0.07
	  3 rocminfo                 0.03     0.00
	  1 lspci                    0.00     0.02
	  1 ps                       0.00     0.01
	 85 sh                       0.00     0.00
	 13 gcc                      0.00     0.00
	  9 gsettings                0.00     0.00
	  8 stat                     0.00     0.00
	  8 systemd-detect-          0.00     0.00
	  6 llvm-link                0.00     0.00
	  5 phoronix-test-s          0.00     0.00
	  4 glxinfo                  0.00     0.00
	  4 gmain                    0.00     0.00
	  3 cat                      0.00     0.00
	  3 dconf worker             0.00     0.00
	  3 gpaw                     0.00     0.00
	  3 rm                       0.00     0.00
	  2 cc                       0.00     0.00
	  2 lscpu                    0.00     0.00
	  2 setterm                  0.00     0.00
	  2 uname                    0.00     0.00
	  2 which                    0.00     0.00
	  1 date                     0.00     0.00
	  1 dirname                  0.00     0.00
	  1 dmesg                    0.00     0.00
	  1 dmidecode                0.00     0.00
	  1 grep                     0.00     0.00
	  1 ifconfig                 0.00     0.00
	  1 ip                       0.00     0.00
	  1 lsmod                    0.00     0.00
	  1 mktemp                   0.00     0.00
	  1 python                   0.00     0.00
	  1 qdbus                    0.00     0.00
	  1 readlink                 0.00     0.00
	  1 realpath                 0.00     0.00
	  1 sed                      0.00     0.00
	  1 sort                     0.00     0.00
	  1 stty                     0.00     0.00
	  1 systemctl                0.00     0.00
	  1 template.sh              0.00     0.00
	  1 wc                       0.00     0.00
0 processes running
47 maximum processes
Computation blocks
      159587) gpaw             cpu=4 start=297.53 finish=584.66
        159588) rm               cpu=5 start=297.53 finish=297.53
        159589) mpirun           cpu=8 start=297.54 finish=584.63
          159595) mpirun           cpu=4 start=297.77 finish=584.63
          159596) mpirun           cpu=9 start=297.77 finish=297.77
          159597) mpirun           cpu=0 start=297.79 finish=584.63
          159599) mpirun           cpu=15 start=297.90 finish=584.63
          159600) mpirun           cpu=9 start=297.90 finish=584.63
          159601) python3          cpu=10 start=297.93 finish=584.60
            159609) python3          cpu=7 start=298.02 finish=584.60
            159612) python3          cpu=6 start=298.03 finish=584.60
          159602) python3          cpu=6 start=297.93 finish=584.60
            159610) python3          cpu=15 start=298.03 finish=584.60
            159613) python3          cpu=7 start=298.03 finish=584.60
          159603) python3          cpu=1 start=297.94 finish=584.60
            159611) python3          cpu=15 start=298.03 finish=584.60
            159614) python3          cpu=11 start=298.03 finish=584.60
          159604) python3          cpu=5 start=297.94 finish=584.60
            159615) python3          cpu=13 start=298.04 finish=584.60
            159616) python3          cpu=8 start=298.04 finish=584.60
          159605) python3          cpu=12 start=297.95 finish=584.60
            159617) python3          cpu=0 start=298.04 finish=584.60
            159619) python3          cpu=4 start=298.05 finish=584.60
          159606) python3          cpu=2 start=297.95 finish=584.60
            159618) python3          cpu=8 start=298.05 finish=584.60
            159620) python3          cpu=13 start=298.05 finish=584.60
          159607) python3          cpu=3 start=297.96 finish=584.60
            159621) python3          cpu=9 start=298.05 finish=584.60
            159622) python3          cpu=9 start=298.06 finish=584.60
          159608) python3          cpu=4 start=297.96 finish=584.60
            159623) python3          cpu=7 start=298.06 finish=584.60
            159624) python3          cpu=15 start=298.06 finish=584.60
        159629) cat              cpu=5 start=584.65 finish=584.66