
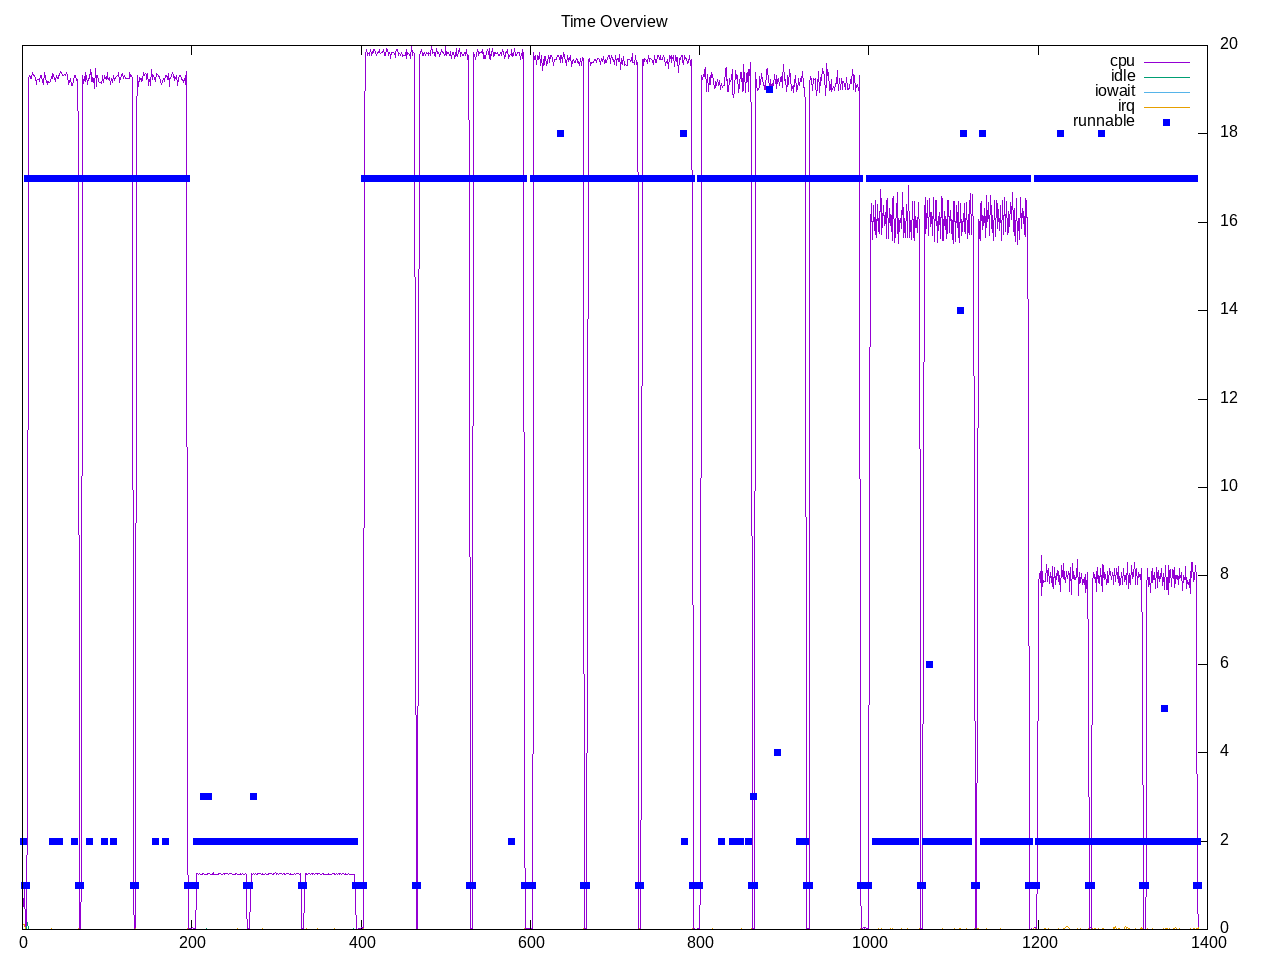
OpenMP implementation that performs imaging tests. This workload has seven tests. Here is a case where Intel does better on two tests and worse on the other five.
Overall metrics shows a fairly high retirement rate that gets limited by backend CPU depending on the test. Backend memory is not as much of an issue.
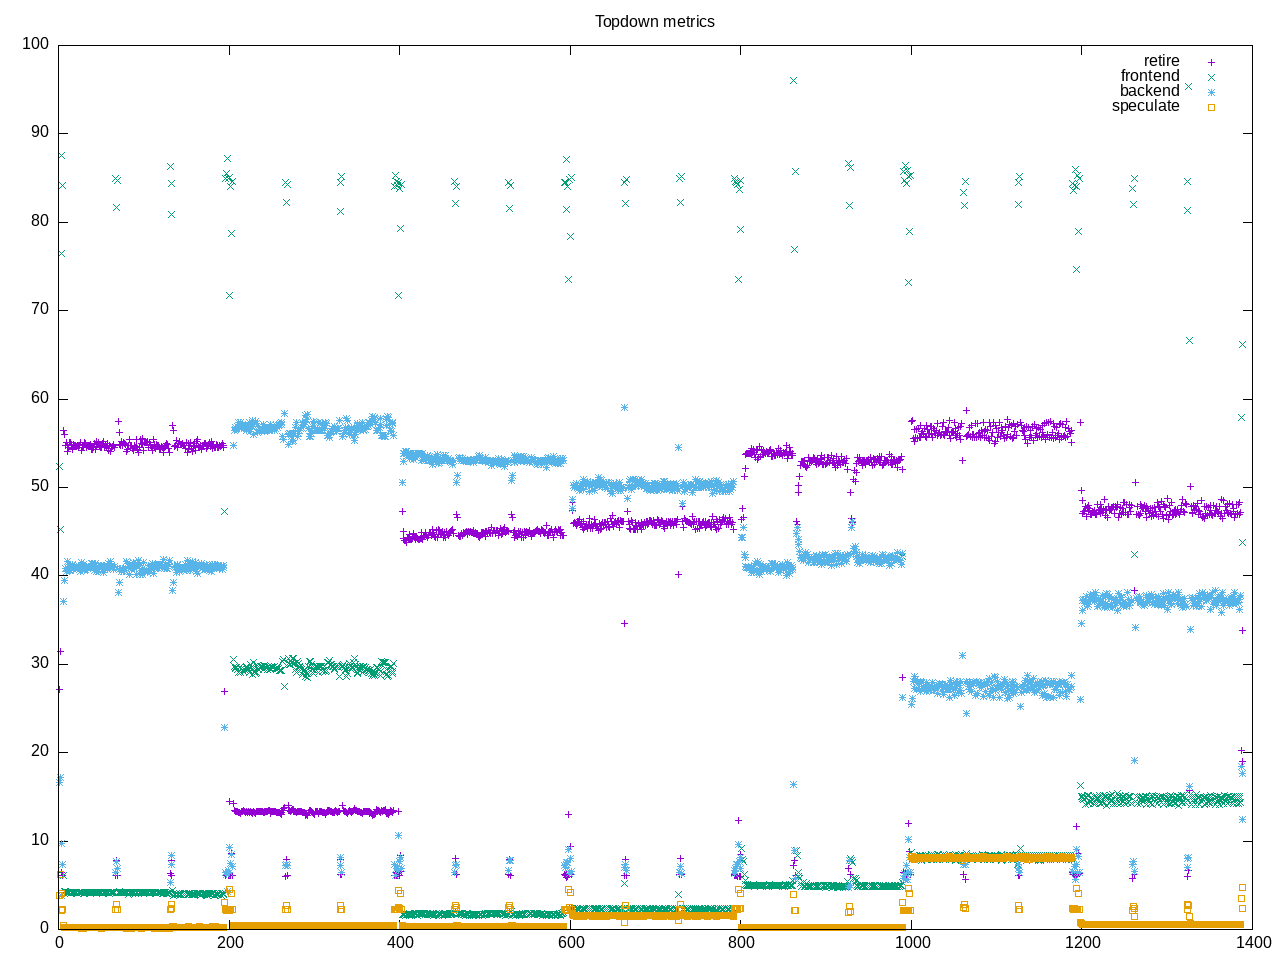
AMD metrics show reasonable floating point code and not as many branches.
elapsed              1644.398
on_cpu               0.678          # 10.85 / 16 cores
utime                17308.374
stime                533.184
nvcsw                210800         # 47.67%
nivcsw               231435         # 52.33%
inblock              0              # 0.00/sec
onblock              16448          # 10.00/sec
cpu-clock            17840403316898 # 17840.403 seconds
task-clock           17840962416578 # 17840.962 seconds
page faults          252232595      # 14137.836/sec
context switches     450222         # 25.235/sec
cpu migrations       1361           # 0.076/sec
major page faults    7744           # 0.434/sec
minor page faults    252224851      # 14137.402/sec
alignment faults     0              # 0.000/sec
emulation faults     0              # 0.000/sec
branches             12792964509200 # 102.333 branches per 1000 inst
branch misses        150169852450   # 1.17% branch miss
conditional          9860363999725  # 78.875 conditional branches per 1000 inst
indirect             568740984297   # 4.549 indirect branches per 1000 inst
cpu-cycles           61383485116311 # 2.76 GHz
instructions         104201051892088 # 1.70 IPC
slots                122743660326036 #
retiring             37571862517062 # 30.6% (49.6%)
-- ucode             28373669760    #     0.0%
-- fastpath          37543488847302 #    30.6%
frontend             4144904451957  #  3.4% ( 5.5%)
-- latency           3064929197046  #     2.5%
-- bandwidth         1079975254911  #     0.9%
backend              32869577134221 # 26.8% (43.4%)
-- cpu               27447483662627 #    22.4%
-- memory            5422093471594  #     4.4%
speculation          1234412203853  #  1.0% ( 1.6%)
-- branch mispredict 1212655803309  #     1.0%
-- pipeline restart  21756400544    #     0.0%
smt-contention       46922793804825 # 38.2% ( 0.0%)
cpu-cycles           61361382873177 # 2.76 GHz
instructions         104032576646593 # 1.70 IPC
instructions         34674101421249 # 5.491 l2 access per 1000 inst
l2 hit from l1       115093256997   # 24.08% l2 miss
l2 miss from l1      20719036688    #
l2 hit from l2 pf    50157748862    #
l3 hit from l2 pf    15765270503    #
l3 miss from l2 pf   9361897652     #
instructions         34673981783248 # 297.334 float per 1000 inst
float 512            72             # 0.000 AVX-512 per 1000 inst
float 256            366            # 0.000 AVX-256 per 1000 inst
float 128            10309748438666 # 297.334 AVX-128 per 1000 inst
float MMX            0              # 0.000 MMX per 1000 inst
float scalar         0              # 0.000 scalar per 1000 inst
Intel metrics
elapsed              2541.963
on_cpu               0.664          # 10.62 / 16 cores
utime                26094.262
stime                908.881
nvcsw                393269         # 53.97%
nivcsw               335418         # 46.03%
inblock              194600         # 76.55/sec
onblock              5536           # 2.18/sec
cpu-clock            27000229963741 # 27000.230 seconds
task-clock           27000708582783 # 27000.709 seconds
page faults          560961765      # 20775.816/sec
context switches     741142         # 27.449/sec
cpu migrations       93087          # 3.448/sec
major page faults    11609          # 0.430/sec
minor page faults    560950155      # 20775.386/sec
alignment faults     0              # 0.000/sec
emulation faults     0              # 0.000/sec
branches             20986332656634 # 124.239 branches per 1000 inst
branch misses        60224093511    # 0.29% branch miss
conditional          20986332688570 # 124.239 conditional branches per 1000 inst
indirect             4793102645941  # 28.375 indirect branches per 1000 inst
slots                91805315111198 #
retiring             58807660233086 # 64.1% (64.1%)
-- ucode             6235444695905  #     6.8%
-- fastpath          52572215537181 #    57.3%
frontend             12103639365990 # 13.2% (13.2%)
-- latency           10394033274777 #    11.3%
-- bandwidth         1709606091213  #     1.9%
backend              17605664593201 # 19.2% (19.2%)
-- cpu               13055563780626 #    14.2%
-- memory            4550100812575  #     5.0%
speculation          3311541093858  #  3.6% ( 3.6%)
-- branch mispredict 3145341811481  #     3.4%
-- pipeline restart  166199282377   #     0.2%
smt-contention       0              #  0.0% ( 0.0%)
cpu-cycles           53809972855771 # 2.22 GHz
instructions         104620904496198 # 1.94 IPC
l2 access            405500583142   # 7.270 l2 access per 1000 inst
l2 miss              186008133845   # 45.87% l2 miss
Process structure shows the gm process is the workhorse.
666 processes
	291 gm                   228017.81  6656.12
	 68 clinfo                  16.54     5.99
	 38 vulkaninfo               0.95     1.33
	  6 glxinfo:gdrv0            0.16     0.07
	  6 php                      0.15     0.22
	  4 vulkani:disk$0           0.10     0.14
	  2 glxinfo                  0.07     0.03
	  2 glxinfo:cs0              0.07     0.03
	  2 glxinfo:disk$0           0.07     0.03
	  2 glxinfo:sh0              0.07     0.03
	  2 glxinfo:shlo0            0.07     0.03
	  6 clang                    0.06     0.05
	  2 llvmpipe-0               0.05     0.07
	  2 llvmpipe-1               0.05     0.07
	  2 llvmpipe-10              0.05     0.07
	  2 llvmpipe-11              0.05     0.07
	  2 llvmpipe-12              0.05     0.07
	  2 llvmpipe-13              0.05     0.07
	  2 llvmpipe-14              0.05     0.07
	  2 llvmpipe-15              0.05     0.07
	  2 llvmpipe-2               0.05     0.07
	  2 llvmpipe-3               0.05     0.07
	  2 llvmpipe-4               0.05     0.07
	  2 llvmpipe-5               0.05     0.07
	  2 llvmpipe-6               0.05     0.07
	  2 llvmpipe-7               0.05     0.07
	  2 llvmpipe-8               0.05     0.07
	  2 llvmpipe-9               0.05     0.07
	  3 rocminfo                 0.00     0.03
	  1 lspci                    0.00     0.02
	 94 sh                       0.00     0.00
	 21 graphics-magick          0.00     0.00
	 13 gcc                      0.00     0.00
	  9 gsettings                0.00     0.00
	  8 stat                     0.00     0.00
	  8 systemd-detect-          0.00     0.00
	  6 llvm-link                0.00     0.00
	  5 phoronix-test-s          0.00     0.00
	  4 gmain                    0.00     0.00
	  3 dconf worker             0.00     0.00
	  2 cc                       0.00     0.00
	  2 lscpu                    0.00     0.00
	  2 uname                    0.00     0.00
	  2 which                    0.00     0.00
	  2 xset                     0.00     0.00
	  1 date                     0.00     0.00
	  1 dirname                  0.00     0.00
	  1 dmesg                    0.00     0.00
	  1 dmidecode                0.00     0.00
	  1 grep                     0.00     0.00
	  1 ifconfig                 0.00     0.00
	  1 ip                       0.00     0.00
	  1 lsmod                    0.00     0.00
	  1 mktemp                   0.00     0.00
	  1 ps                       0.00     0.00
	  1 qdbus                    0.00     0.00
	  1 readlink                 0.00     0.00
	  1 realpath                 0.00     0.00
	  1 sed                      0.00     0.00
	  1 sort                     0.00     0.00
	  1 stty                     0.00     0.00
	  1 systemctl                0.00     0.00
	  1 template.sh              0.00     0.00
	  1 wc                       0.00     0.00
	  1 xrandr                   0.00     0.00
0 processes running
47 maximum processes
We seem to start one thread on each core.
      98515) graphics-magick  cpu=14 start=6.18  finish=66.22
        98516) gm               cpu=7 start=6.18  finish=66.22
          98517) gm               cpu=15 start=6.19  finish=66.22
          98518) gm               cpu=2 start=6.19  finish=66.22
          98519) gm               cpu=12 start=6.19  finish=66.22
          98520) gm               cpu=5 start=6.19  finish=66.22
          98521) gm               cpu=4 start=6.19  finish=66.22
          98522) gm               cpu=1 start=6.19  finish=66.22
          98523) gm               cpu=0 start=6.19  finish=66.22
          98524) gm               cpu=14 start=6.19  finish=66.22
          98525) gm               cpu=10 start=6.19  finish=66.22
          98526) gm               cpu=11 start=6.19  finish=66.22
          98527) gm               cpu=8 start=6.19  finish=66.22
          98528) gm               cpu=3 start=6.19  finish=66.22
          98529) gm               cpu=13 start=6.19  finish=66.22
          98530) gm               cpu=9 start=6.19  finish=66.22
          98531) gm               cpu=6 start=6.19  finish=66.22