
Molecular dynamics package for chemical simulations. Shows a high amount of time in the backend where both CPU and memory contribute.
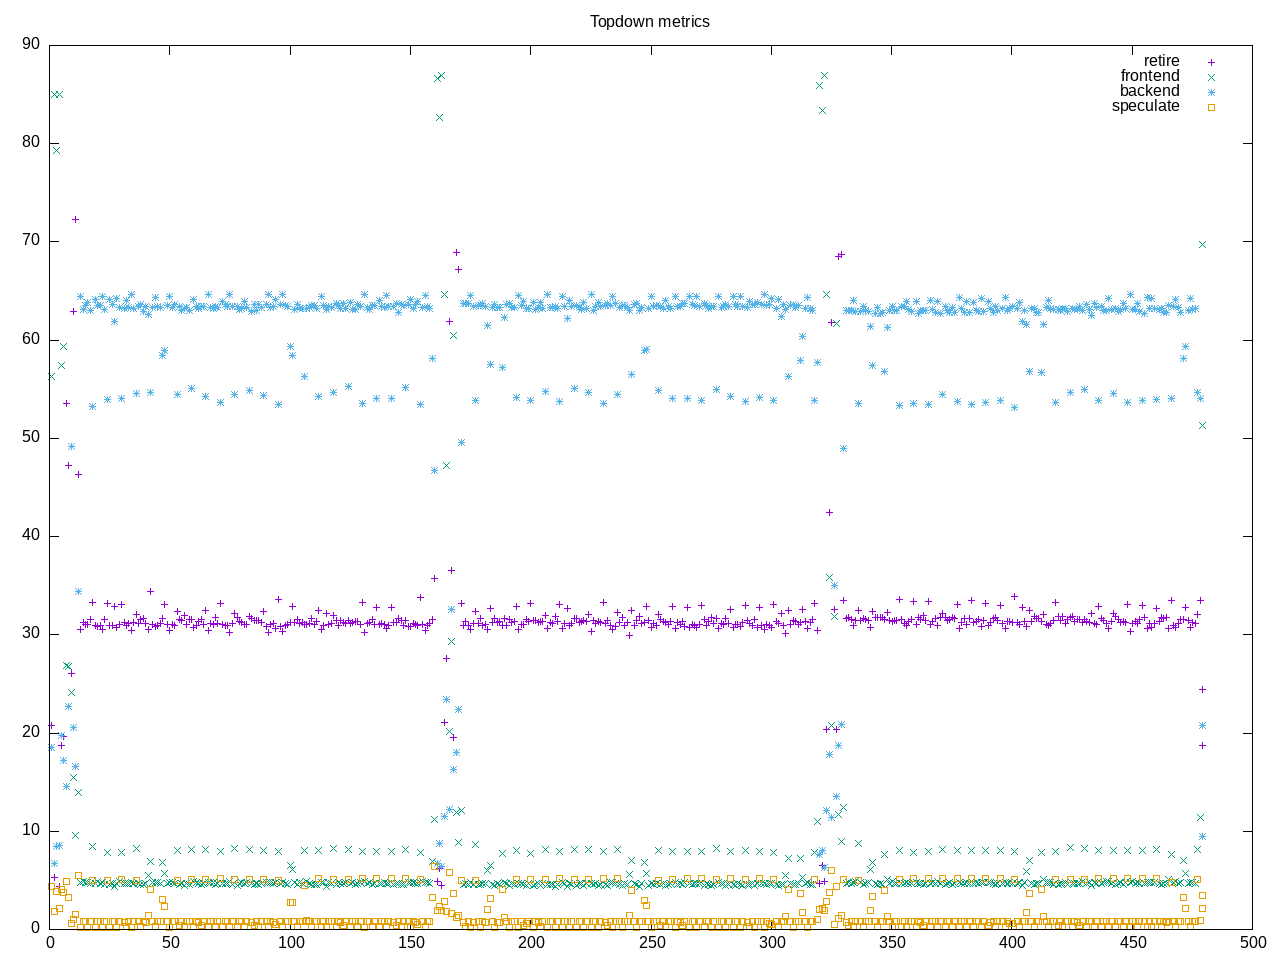
AMD metrics show we only spend ~50% of the time on the CPU. There is a moderate amount of I/O so likely waiting there. There is some floating point but much less than other codes such as namd.
elapsed              482.655
on_cpu               0.476          # 7.61 / 16 cores
utime                3565.437
stime                108.786
nvcsw                72583          # 86.38%
nivcsw               11441          # 13.62%
inblock              267168         # 553.54/sec
onblock              751504         # 1557.02/sec
cpu-clock            3674433961350  # 3674.434 seconds
task-clock           3674472081380  # 3674.472 seconds
page faults          5786497        # 1574.783/sec
context switches     86216          # 23.464/sec
cpu migrations       2090           # 0.569/sec
major page faults    2125           # 0.578/sec
minor page faults    5784372        # 1574.205/sec
alignment faults     0              # 0.000/sec
emulation faults     0              # 0.000/sec
branches             944150288240   # 31.083 branches per 1000 inst
branch misses        13146281378    # 1.39% branch miss
conditional          715415461727   # 23.552 conditional branches per 1000 inst
indirect             36389905918    # 1.198 indirect branches per 1000 inst
cpu-cycles           15950171457573 # 2.07 GHz
instructions         30275006717964 # 1.90 IPC
slots                31897501627062 #
retiring             10256456755117 # 32.2% (32.2%)
-- ucode             11587443035    #     0.0%
-- fastpath          10244869312082 #    32.1%
frontend             1782822670565  #  5.6% ( 5.6%)
-- latency           1041193668954  #     3.3%
-- bandwidth         741629001611   #     2.3%
backend              19397722726257 # 60.8% (60.8%)
-- cpu               8131906328178  #    25.5%
-- memory            11265816398079 #    35.3%
speculation          442612899648   #  1.4% ( 1.4%)
-- branch mispredict 424617941550   #     1.3%
-- pipeline restart  17994958098    #     0.1%
smt-contention       17876810980    #  0.1% ( 0.0%)
cpu-cycles           15914711735792 # 2.07 GHz
instructions         30248693256001 # 1.90 IPC
instructions         10090949159980 # 24.975 l2 access per 1000 inst
l2 hit from l1       152624079844   # 18.65% l2 miss
l2 miss from l1      16245693931    #
l2 hit from l2 pf    68637530034    #
l3 hit from l2 pf    3233438783     #
l3 miss from l2 pf   27522248586    #
instructions         10078247012013 # 67.501 float per 1000 inst
float 512            79             # 0.000 AVX-512 per 1000 inst
float 256            124            # 0.000 AVX-256 per 1000 inst
float 128            680293984159   # 67.501 AVX-128 per 1000 inst
float MMX            0              # 0.000 MMX per 1000 inst
float scalar         0              # 0.000 scalar per 1000 inst
Intel metrics
elapsed              832.937
on_cpu               0.731          # 11.69 / 16 cores
utime                9542.274
stime                198.469
nvcsw                99850          # 79.04%
nivcsw               26479          # 20.96%
inblock              6552
onblock              2191480
cpu-clock            9741000680111  # 9741.001 seconds
task-clock           9741049746853  # 9741.050 seconds
page faults          7930295        # 814.111/sec
context switches     130264         # 13.373/sec
cpu migrations       12544          # 1.288/sec
major page faults    764            # 0.078/sec
minor page faults    7929531        # 814.032/sec
alignment faults     0              # 0.000/sec
emulation faults     0              # 0.000/sec
branches             2682985873307  # 65.358 branches per 1000 inst
branch misses        16668425938    # 0.62% branch miss
conditional          2682985889723  # 65.358 conditional branches per 1000 inst
indirect             406967729044   # 9.914 indirect branches per 1000 inst
slots                63845246869628 #
retiring             34233072745943 # 53.6% (53.6%)
-- ucode             1863060964672  #     2.9%
-- fastpath          32370011781271 #    50.7%
frontend             8219305390172  # 12.9% (12.9%)
-- latency           6780205223367  #    10.6%
-- bandwidth         1439100166805  #     2.3%
backend              19478016926828 # 30.5% (30.5%)
-- cpu               5033487906332  #     7.9%
-- memory            14444529020496 #    22.6%
speculation          2127848416049  #  3.3% ( 3.3%)
-- branch mispredict 2019288962047  #     3.2%
-- pipeline restart  108559454002   #     0.2%
smt-contention       0              #  0.0% ( 0.0%)
cpu-cycles           22207184550713 # 1.67 GHz
instructions         32171673180975 # 1.45 IPC
l2 access            432584423400   # 14.223 l2 access per 1000 inst
l2 miss              150307005673   # 34.75% l2 miss
No process information as the program currently hangs with a parallel make.