
Apache Hadoop using a built-in benchmark. The test itself has multiple configurations, picked one slightly smaller one with operations for open, create, delete, rename and file status. These are done with 50 threads and 100,000 files. These seem to be spiky in terms of how much on-core is used.

All the operations appear to have similar profiles.
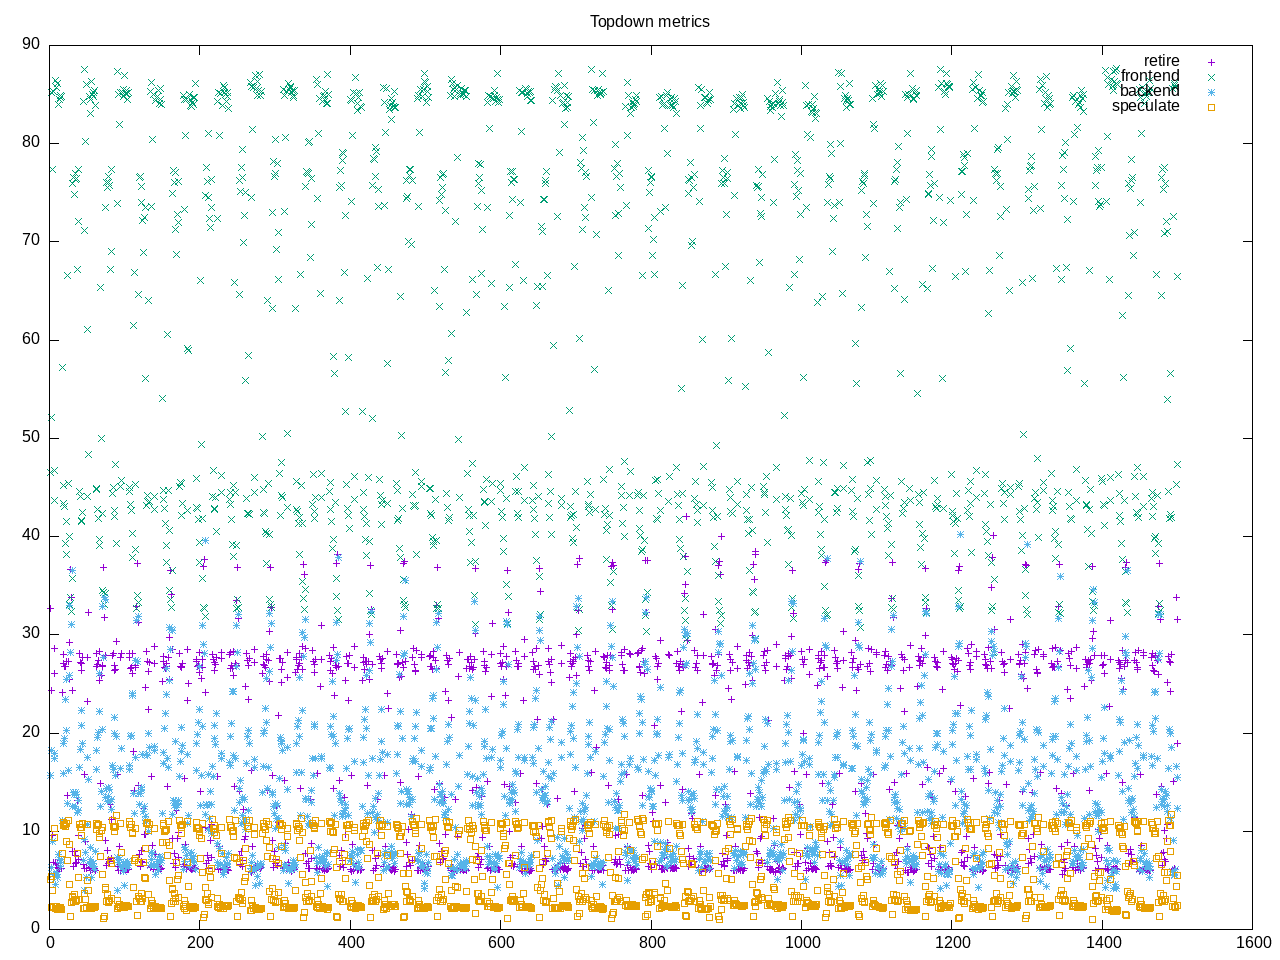
AMD profile shows on average only one core. There is a reasonable branch misprediction ratio and higher icache misses contributing to front end stalls.
elapsed              1645.269
on_cpu               0.066          # 1.06 / 16 cores
utime                1483.955
stime                266.041
nvcsw                19302655       # 97.72%
nivcsw               449656         # 2.28%
inblock              0              # 0.00/sec
onblock              12071720       # 7337.23/sec
cpu-clock            2033061393428  # 2033.061 seconds
task-clock           2040938903340  # 2040.939 seconds
page faults          32715886       # 16029.821/sec
context switches     21041669       # 10309.799/sec
cpu migrations       4409281        # 2160.418/sec
major page faults    13             # 0.006/sec
minor page faults    32693761       # 16018.981/sec
alignment faults     0              # 0.000/sec
emulation faults     0              # 0.000/sec
branches             2440557014096  # 192.814 branches per 1000 inst
branch misses        70292043999    # 2.88% branch miss
conditional          1985101834707  # 156.831 conditional branches per 1000 inst
indirect             88675993406    # 7.006 indirect branches per 1000 inst
cpu-cycles           7283153577899  # 0.27 GHz
instructions         12733302691242 # 1.75 IPC
slots                15117443150724 #
retiring             4093571277912  # 27.1% (28.8%)
-- ucode             18565784593    #     0.1%
-- fastpath          4075005493319  #    27.0%
frontend             5668074910837  # 37.5% (39.9%)
-- latency           4187468977962  #    27.7%
-- bandwidth         1480605932875  #     9.8%
backend              3252934091472  # 21.5% (22.9%)
-- cpu               440157329922   #     2.9%
-- memory            2812776761550  #    18.6%
speculation          1178546967447  #  7.8% ( 8.3%)
-- branch mispredict 1162848752037  #     7.7%
-- pipeline restart  15698215410    #     0.1%
smt-contention       922950531585   #  6.1% ( 0.0%)
cpu-cycles           6723415939481  # 0.27 GHz
instructions         11687210661615 # 1.74 IPC
instructions         3949493254292  # 35.068 l2 access per 1000 inst
l2 hit from l1       117662844689   # 23.41% l2 miss
l2 miss from l1      22225189608    #
l2 hit from l2 pf    10639199506    #
l3 hit from l2 pf    7690790023     #
l3 miss from l2 pf   2506757202     #
instructions         3939984934674  # 12.396 float per 1000 inst
float 512            5876           # 0.000 AVX-512 per 1000 inst
float 256            580696         # 0.000 AVX-256 per 1000 inst
float 128            48840297285    # 12.396 AVX-128 per 1000 inst
float MMX            0              # 0.000 MMX per 1000 inst
float scalar         26670          # 0.000 scalar per 1000 inst
instructions         14677205691183 #
opcache              2833928335429  # 193.084 opcache per 1000 inst
opcache miss         423825305666   # 15.0% opcache miss rate
l1 dTLB miss         43954457210    # 2.995 L1 dTLB per 1000 inst
l2 dTLB miss         2729867433     # 0.186 L2 dTLB per 1000 inst
instructions         11454228858121 #
icache               618852003376   # 54.028 icache per 1000 inst
icache miss          163637198109   # 26.4% icache miss rate
l1 iTLB miss         10599527518    # 0.925 L1 iTLB per 1000 inst
l2 iTLB miss         0              # 0.000 L2 iTLB per 1000 inst
tlb flush            4179118        # 0.000 TLB flush per 1000 inst
Intel metrics show L2 memory has heaviest usage.
elapsed              1908.392
on_cpu               0.073          # 1.17 / 16 cores
utime                1967.641
stime                272.647
nvcsw                19875397       # 93.34%
nivcsw               1417344        # 6.66%
inblock              5600           # 2.93/sec
onblock              12147032       # 6365.06/sec
cpu-clock            2609535955733  # 2609.536 seconds
task-clock           2618682297029  # 2618.682 seconds
page faults          32849851       # 12544.420/sec
context switches     22854844       # 8727.612/sec
cpu migrations       6394302        # 2441.801/sec
major page faults    32             # 0.012/sec
minor page faults    32829180       # 12536.526/sec
alignment faults     0              # 0.000/sec
emulation faults     0              # 0.000/sec
branches             3342701443304  # 197.833 branches per 1000 inst
branch misses        63340712362    # 1.89% branch miss
conditional          3342703351624  # 197.833 conditional branches per 1000 inst
indirect             418999339481   # 24.798 indirect branches per 1000 inst
slots                30031057052438 #
retiring             11866028127417 # 39.5% (39.5%)
-- ucode             546411586624   #     1.8%
-- fastpath          11319616540793 #    37.7%
frontend             7206824202511  # 24.0% (24.0%)
-- latency           3954378356567  #    13.2%
-- bandwidth         3252445845944  #    10.8%
backend              6063507461747  # 20.2% (20.2%)
-- cpu               4004372975049  #    13.3%
-- memory            2059134486698  #     6.9%
speculation          5089708599852  # 16.9% (16.9%) high
-- branch mispredict 4965012099294  #    16.5%
-- pipeline restart  124696500558   #     0.4%
smt-contention       0              #  0.0% ( 0.0%)
cpu-cycles           8613657887438  # 0.28 GHz
instructions         20456692773872 # 2.37 IPC
l2 access            296465887800   # 22.784 l2 access per 1000 inst
l2 miss              89267010975    # 30.11% l2 miss
cpu-cycles           5466044200874  # 18.1% memory latency
load stalls          924169128515   #  1.0% l1 bound
l1 miss              871316263366   #  9.0% l2 bound
l2 miss              379565201362   #  4.1% l3 bound
l3 miss              157380003321   #  2.9% dram bound
store_stalls         67401023726    #  1.2% store bound
Process profile shows a large number of processes.
61181 processes
	351 org.apache.hado       5364.25   856.42
	1172 java                  3719.09   430.50
	147 qtp1346799731-3       2700.20   471.70
	586 Finalizer             1859.53   215.18
	585 Common-Cleaner        1859.43   215.11
	105 qtp1174248013-3       1854.74   304.29
	585 Logging-Cleaner       1851.69   212.62
	195 Hadoop-Metrics-       1842.68   207.92
	 75 StatsDaemon-41        1209.12   215.25
	 75 StatsDaemon-18        1209.05   215.16
	 75 StatsDaemon-42        1208.61   215.17
	 75 StatsDaemon-46        1208.29   215.30
	 75 StatsDaemon-40        1207.93   215.20
	 75 StatsDaemon-25        1207.88   215.12
	 75 StatsDaemon-33        1207.70   215.15
	 75 StatsDaemon-49        1207.69   215.28
	 75 StatsDaemon-47        1207.65   215.32
	 75 StatsDaemon-45        1207.45   215.30
	 75 StatsDaemon-28        1207.42   215.09
	 75 StatsDaemon-29        1207.30   215.12
	 75 StatsDaemon-32        1207.24   215.12
	 75 StatsDaemon-20        1207.21   215.13
	 75 StatsDaemon-44        1207.19   215.22
	 75 StatsDaemon-39        1207.18   215.14
	 75 StatsDaemon-23        1207.11   215.19
	 75 StatsDaemon-34        1207.11   215.12
	 75 StatsDaemon-24        1207.04   215.20
	 75 StatsDaemon-15        1207.01   215.17
	 75 StatsDaemon-26        1206.99   215.08
	 75 StatsDaemon-30        1206.82   215.08
	 75 StatsDaemon-38        1206.80   215.10
	 75 StatsDaemon-37        1206.78   215.20
	 75 StatsDaemon-27        1206.73   215.14
	 75 StatsDaemon-43        1206.66   215.24
	 75 StatsDaemon-19        1206.60   215.13
	 75 StatsDaemon-17        1206.59   215.10
	 75 StatsDaemon-31        1206.56   215.06
	 75 StatsDaemon-36        1206.21   215.09
	 75 StatsDaemon-48        1206.00   215.18
	 75 StatsDaemon-16        1205.83   215.10
	 75 StatsDaemon-21        1205.73   215.08
	 75 StatsDaemon-35        1205.61   215.19
	 75 StatsDaemon-14        1205.53   215.03
	 75 StatsDaemon-22        1204.71   215.14
	 75 StatsDaemon-13        1204.13   214.80
	 75 StatsDaemon-12        1202.89   214.86
	 75 StatsDaemon-5         1202.57   214.51
	 75 StatsDaemon-8         1202.54   214.61
	 75 StatsDaemon-7         1202.25   214.63
	 75 StatsDaemon-6         1201.79   214.50
	 75 StatsDaemon-11        1201.59   214.77
	 75 StatsDaemon-9         1201.59   214.57
	 75 StatsDaemon-3         1201.18   214.60
	 75 StatsDaemon-1         1200.91   214.36
	 75 StatsDaemon-4         1200.80   214.50
	 75 StatsDaemon-10        1200.07   214.47
	 75 StatsDaemon-0         1199.48   214.04
	 75 StatsDaemon-2         1199.35   214.31
	 63 qtp1346799731-2       1157.37   202.20
	 78 Session-HouseKe        979.42   138.82
	115 ForkJoinPool.co        856.56    69.77
	 45 qtp1174248013-2        794.97   130.41
	 39 AsyncAppender-D        693.12   116.80
	 39 pool-2-thread-1        690.09   116.47
	 39 pool-1-thread-1        689.93   116.45
	 39 DatanodeAdminMo        684.76   116.29
	 39 MarkedDeleteBlo        684.73   116.29
	 39 RedundancyMonit        684.66   116.29
	 39 pool-7-thread-1        684.19   116.07
	 39 CacheReplicatio        684.12   116.03
	 39 FSEditLogAsync         683.11   115.62
	 75 qtp2134157671-3        549.43    41.05
	 75 qtp2134157671-4        549.04    41.05
	585 Thread-0               457.67    59.84
	 78 Thread-1               420.35    37.35
	 78 shutdown-hook-0        419.47    37.11
	 39 Timer-0                290.16    23.46
	 39 Timer-1                290.16    23.46
	 39 Timer-2                290.16    23.46
	 39 Thread[Thread-2        290.16    23.44
	 39 NodeLabelManage        290.12    23.39
	 39 AttributeNodeLa        290.12    23.38
	 39 ActivitiesManag        290.11    23.37
	 39 ResourceManager        290.09    23.36
	 39 SchedulerEventD        290.09    23.36
	 39 Timer-3                290.00    23.23
	 39 ApplicationMast        289.48    22.86
	 39 pool-5-thread-1        287.88    22.16
	 39 Thread[Thread-1        287.87    22.15
	 39 pool-4-thread-1        287.80    22.10
	 24 qtp715289224-35        178.80    14.18
	 24 qtp715289224-36        178.79    14.17
	 24 qtp715289224-37        178.78    14.17
	 24 qtp715289224-38        178.77    14.16
	 24 qtp715289224-39        178.77    14.16
	 24 qtp715289224-40        178.77    14.16
	 24 qtp715289224-41        178.76    14.16
	 24 qtp715289224-42        178.75    14.16
	 24 qtp715289224-47        178.70    14.15
	 24 qtp715289224-48        178.69    14.16
	 39 ForkJoinPool-1-        153.67    14.38
	 39 Thread-23              149.70    13.89
	 39 fsimage_0000000        135.15    12.18
	  3 qtp726408598-27         40.72     5.71
	  3 qtp726408598-28         40.72     5.71
	  3 qtp726408598-29         40.72     5.71
	  3 qtp726408598-30         40.72     5.71
	  3 qtp726408598-31         40.72     5.71
	  3 qtp726408598-32         40.72     5.71
	  3 qtp726408598-33         40.72     5.71
	  3 qtp726408598-34         40.72     5.71
	  3 qtp726408598-37         40.72     5.71
	  3 qtp726408598-38         40.72     5.71
	 68 clinfo                  19.51     6.65
	7720 bash                     2.61     2.24
	 38 vulkaninfo               1.52     1.52
	312 ssh                      0.55     0.00
	  6 glxinfo:gdrv0            0.19     0.01
	  6 glxinfo:gl0              0.19     0.01
	  4 vulkani:disk$0           0.16     0.16
	  6 php                      0.14     0.59
	  2 glxinfo                  0.09     0.01
	  2 glxinfo:cs0              0.09     0.01
	  2 glxinfo:disk$0           0.09     0.01
	  2 glxinfo:sh0              0.09     0.01
	  2 glxinfo:shlo0            0.09     0.01
	  2 llvmpipe-0               0.08     0.08
	  2 llvmpipe-1               0.08     0.08
	  2 llvmpipe-10              0.08     0.08
	  2 llvmpipe-11              0.08     0.08
	  2 llvmpipe-12              0.08     0.08
	  2 llvmpipe-13              0.08     0.08
	  2 llvmpipe-14              0.08     0.08
	  2 llvmpipe-15              0.08     0.08
	  2 llvmpipe-2               0.08     0.08
	  2 llvmpipe-3               0.08     0.08
	  2 llvmpipe-4               0.08     0.08
	  2 llvmpipe-5               0.08     0.08
	  2 llvmpipe-6               0.08     0.08
	  2 llvmpipe-7               0.08     0.08
	  2 llvmpipe-8               0.08     0.08
	  2 llvmpipe-9               0.08     0.08
	  6 clang                    0.04     0.08
	  3 rocminfo                 0.03     0.00
	118 ps                       0.01     0.72
	  1 lspci                    0.01     0.02
	586 G1 Main Marker           0.01     0.00
	586 G1 Young RemSet          0.01     0.00
	586 VM Periodic Tas          0.01     0.00
	4084 C2 CompilerThre          0.00 16655.19
	2431 C1 CompilerThre          0.00  8550.02
	586 GC Thread#0              0.00  1859.56
	586 G1 Conc#0                0.00  1859.55
	586 Reference Handl          0.00  1859.55
	586 Service Thread           0.00  1859.53
	586 Signal Dispatch          0.00  1859.52
	586 Sweeper thread           0.00  1859.47
	586 VM Thread                0.00  1859.44
	585 GC Thread#1              0.00  1859.38
	585 GC Thread#2              0.00  1859.35
	585 GC Thread#3              0.00  1859.35
	585 GC Thread#4              0.00  1859.34
	585 GC Thread#5              0.00  1859.34
	585 GC Thread#6              0.00  1859.33
	585 GC Thread#7              0.00  1859.33
	585 GC Thread#9              0.00  1859.32
	585 GC Thread#8              0.00  1859.31
	585 process reaper           0.00  1859.30
	586 G1 Refine#0              0.00  1856.61
	117 G1 Conc#1                0.00  1113.65
	117 G1 Conc#2                0.00  1113.63
	 78 GC Thread#10             0.00   983.92
	 78 GC Thread#11             0.00   983.92
	 78 GC Thread#12             0.00   983.92
	 78 SSL Certificate          0.00   822.85
	 39 GcTimeMonitor o          0.00   693.13
	 39 SIGTERM handler          0.00   290.79
	 39 Pending Contain          0.00   290.12
	 12 G1 Refine#1              0.00   214.25
	  9 G1 Refine#2              0.00   157.67
	 39 Reconstruction           0.00   153.28
	 39 FSImageSaver fo          0.00   124.47
	  5 G1 Refine#3              0.00    92.45
	  3 G1 Refine#4              0.00    61.56
	  3 G1 Refine#5              0.00    61.56
	  3 G1 Refine#6              0.00    61.56
	  3 G1 Refine#7              0.00    61.56
	  3 G1 Refine#8              0.00    61.56
	  3 G1 Refine#9              0.00    61.56
	  2 G1 Refine#10             0.00    40.91
	11272 dirname                  0.00     0.00
	6279 IPC Server hand          0.00     0.00
	1209 sysctl                   0.00     0.00
	975 basename                 0.00     0.00
	469 sed                      0.00     0.00
	351 rm                       0.00     0.00
	273 sleep                    0.00     0.00
	195 IPC Server Resp          0.00     0.00
	195 IPC Server idle          0.00     0.00
	195 IPC Server list          0.00     0.00
	195 Ping Checker fo          0.00     0.00
	195 Socket Reader #          0.00     0.00
	195 mv                       0.00     0.00
	158 uname                    0.00     0.00
	156 hostname                 0.00     0.00
	156 touch                    0.00     0.00
	117 cat                      0.00     0.00
	 90 sh                       0.00     0.00
	 78 cut                      0.00     0.00
	 78 hadoop                   0.00     0.00
	 78 tr                       0.00     0.00
	 39 Block report pr          0.00     0.00
	 39 Node Removal Ti          0.00     0.00
	 39 RM Event dispat          0.00     0.00
	 39 RM StateStore d          0.00     0.00
	 39 Timer for 'Name          0.00     0.00
	 39 Timer for 'Reso          0.00     0.00
	 39 df                       0.00     0.00
	 39 renice                   0.00     0.00
	 12 gcc                      0.00     0.00
	 11 gsettings                0.00     0.00
	  8 stat                     0.00     0.00
	  8 systemd-detect-          0.00     0.00
	  6 llvm-link                0.00     0.00
	  5 phoronix-test-s          0.00     0.00
	  3 gmain                    0.00     0.00
	  2 dconf worker             0.00     0.00
	  2 lscpu                    0.00     0.00
	  2 which                    0.00     0.00
	  2 xset                     0.00     0.00
	  1 cc                       0.00     0.00
	  1 date                     0.00     0.00
	  1 dmesg                    0.00     0.00
	  1 dmidecode                0.00     0.00
	  1 grep                     0.00     0.00
	  1 ifconfig                 0.00     0.00
	  1 ip                       0.00     0.00
	  1 lsmod                    0.00     0.00
	  1 mktemp                   0.00     0.00
	  1 qdbus                    0.00     0.00
	  1 readlink                 0.00     0.00
	  1 realpath                 0.00     0.00
	  1 sort                     0.00     0.00
	  1 stty                     0.00     0.00
	  1 systemctl                0.00     0.00
	  1 template.sh              0.00     0.00
	  1 wc                       0.00     0.00
	  1 xrandr                   0.00     0.00
1 processes running
396 maximum processes