
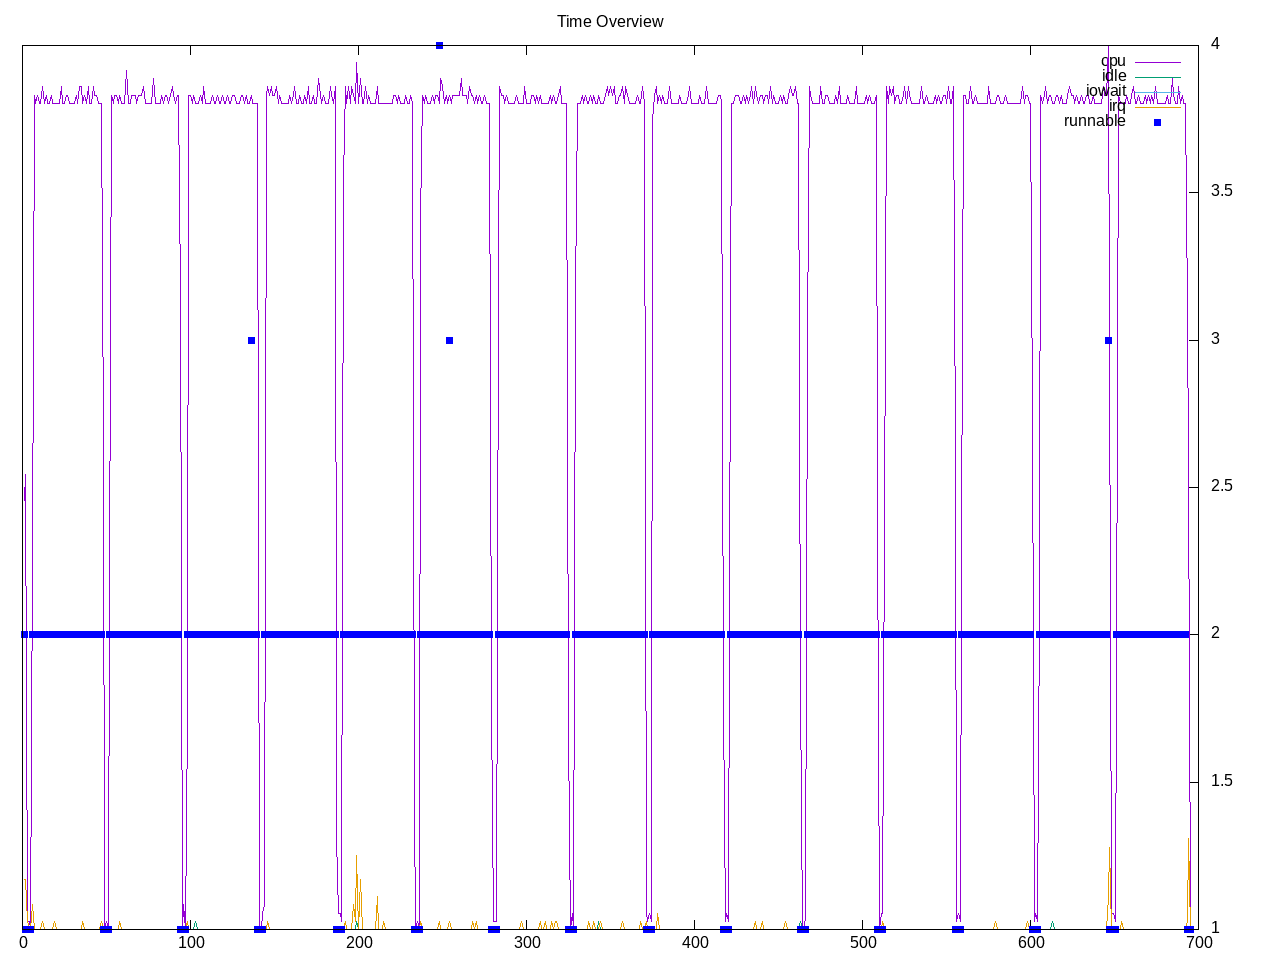
Linear solver of pressure Poisson using a point-Jacobi method. This is one of fed tests where Intel CPU performs substantially better (6046) than AMD CPU (3966). It is also a case where AMD has a variable rate. This looks like a single-threaded test.
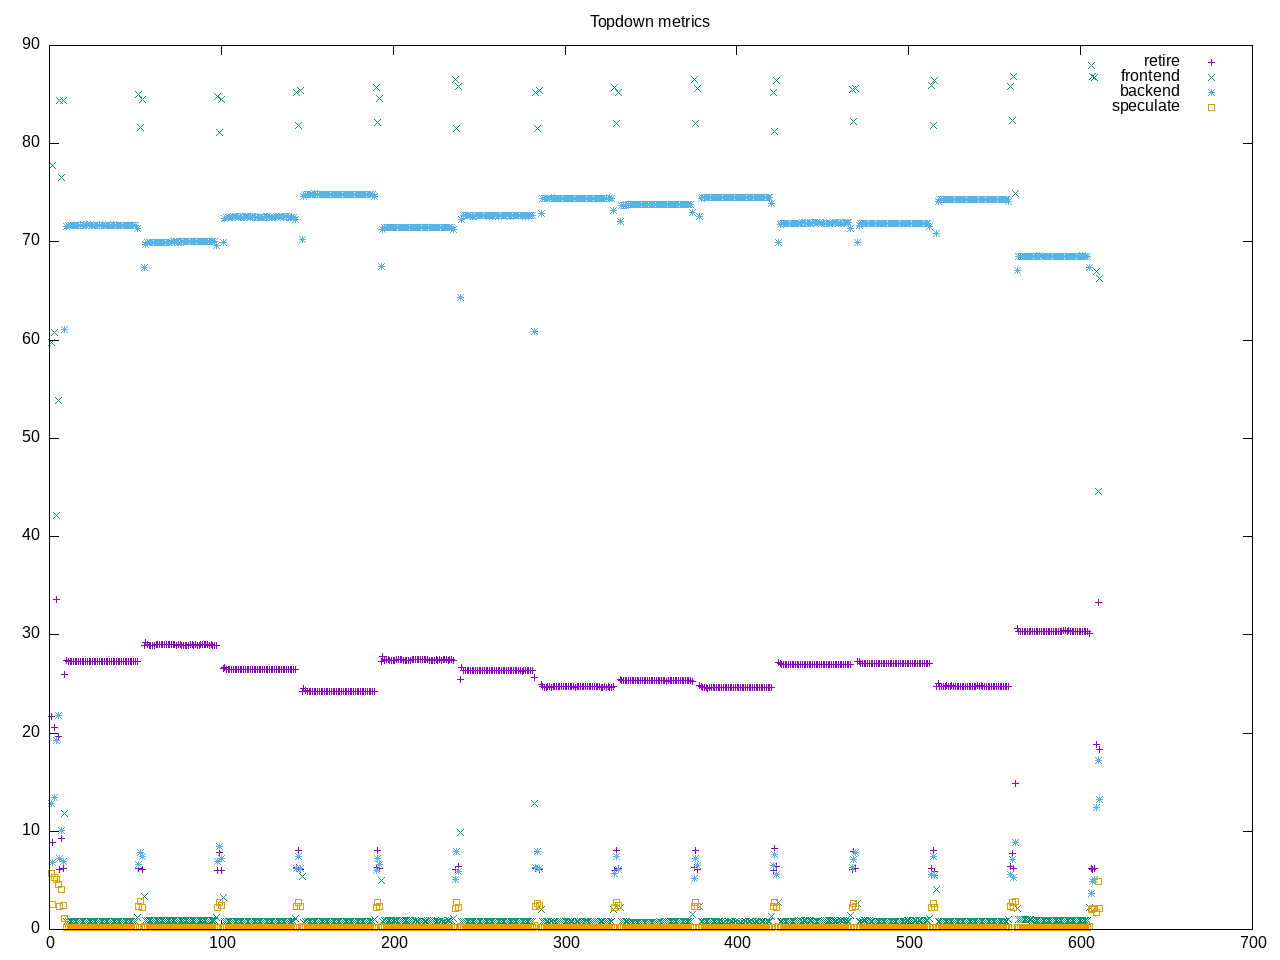
Topdown profile shows high backend stalls, both CPU and memory. It also suggests multiple rounds of tests to find a stable point. Frontend stalls are some of the smallest of all benchmarks. Perhaps interesting to see factors here like code/data footprint sizes?
AMD metrics show a floating point program with some L2 access and misses.
elapsed              562.793
on_cpu               0.056          # 0.90 / 16 cores
utime                506.784
stime                1.067
nvcsw                2113           # 51.46%
nivcsw               1993           # 48.54%
inblock              0              # 0.00/sec
onblock              12800          # 22.74/sec
cpu-clock            507956077142   # 507.956 seconds
task-clock           507965279796   # 507.965 seconds
page faults          240790         # 474.028/sec
context switches     6723           # 13.235/sec
cpu migrations       325            # 0.640/sec
major page faults    2              # 0.004/sec
minor page faults    240788         # 474.025/sec
alignment faults     0              # 0.000/sec
emulation faults     0              # 0.000/sec
branches             78486493682    # 20.748 branches per 1000 inst
branch misses        624071097      # 0.80% branch miss
conditional          77692509960    # 20.538 conditional branches per 1000 inst
indirect             47753355       # 0.013 indirect branches per 1000 inst
cpu-cycles           2940577091356  # 0.26 GHz
instructions         4771889380353  # 1.62 IPC
slots                5884521661530  #
retiring             1586483683880  # 27.0% (27.0%)
-- ucode             14146366       #     0.0%
-- fastpath          1586469537514  #    27.0%
frontend             55781933015    #  0.9% ( 0.9%) low
-- latency           31688469264    #     0.5%
-- bandwidth         24093463751    #     0.4%
backend              4231018348818  # 71.9% (71.9%) high
-- cpu               2277772735762  #    38.7%
-- memory            1953245613056  #    33.2%
speculation          11018268385    #  0.2% ( 0.2%) low
-- branch mispredict 10153156053    #     0.2%
-- pipeline restart  865112332      #     0.0%
smt-contention       218961520      #  0.0% ( 0.0%)
cpu-cycles           2938472632454  # 0.26 GHz
instructions         4629990328053  # 1.58 IPC
instructions         1544094148954  # 88.762 l2 access per 1000 inst
l2 hit from l1       80167148026    # 20.63% l2 miss
l2 miss from l1      1331488191     #
l2 hit from l2 pf    29950113188    #
l3 hit from l2 pf    13061396001    #
l3 miss from l2 pf   13878019099    #
instructions         1543498098310  # 184.685 float per 1000 inst
float 512            69             # 0.000 AVX-512 per 1000 inst
float 256            518            # 0.000 AVX-256 per 1000 inst
float 128            285061640703   # 184.685 AVX-128 per 1000 inst
float MMX            0              # 0.000 MMX per 1000 inst
float scalar         0              # 0.000 scalar per 1000 inst
Intel metrics
elapsed              168.565
on_cpu               0.057          # 0.92 / 16 cores
utime                154.165
stime                0.438
nvcsw                1887           # 74.50%
nivcsw               646            # 25.50%
inblock              0              # 0.00/sec
onblock              1312           # 7.78/sec
cpu-clock            154630765914   # 154.631 seconds
task-clock           154634206479   # 154.634 seconds
page faults          159168         # 1029.319/sec
context switches     3205           # 20.726/sec
cpu migrations       321            # 2.076/sec
major page faults    0              # 0.000/sec
minor page faults    159168         # 1029.319/sec
alignment faults     0              # 0.000/sec
emulation faults     0              # 0.000/sec
branches             35913794453    # 21.089 branches per 1000 inst
branch misses        88509738       # 0.25% branch miss
conditional          35913806389    # 21.089 conditional branches per 1000 inst
indirect             59414046       # 0.035 indirect branches per 1000 inst
slots                3725864821436  #
retiring             2390025479822  # 64.1% (64.1%) high
-- ucode             620664419824   #    16.7%
-- fastpath          1769361059998  #    47.5%
frontend             553782693331   # 14.9% (14.9%)
-- latency           17755344084    #     0.5%
-- bandwidth         536027349247   #    14.4%
backend              769551179018   # 20.7% (20.7%)
-- cpu               500685850178   #    13.4%
-- memory            268865328840   #     7.2%
speculation          17170761530    #  0.5% ( 0.5%) low
-- branch mispredict 12411755919    #     0.3%
-- pipeline restart  4759005611     #     0.1%
smt-contention       0              #  0.0% ( 0.0%)
cpu-cycles           648805684715   # 0.22 GHz
instructions         1890731557963  # 2.91 IPC
l2 access            101309940231   # 53.657 l2 access per 1000 inst
l2 miss              59683326414    # 58.91% l2 miss
Process overview suggests computation in the himenobmtxpa application
372 processes
	 12 himenobmtxpa           506.42     0.11
	 68 clinfo                  16.48     6.32
	 38 vulkaninfo               0.76     1.53
	  6 glxinfo:gdrv0            0.11     0.07
	  6 glxinfo:gl0              0.11     0.06
	  4 vulkani:disk$0           0.08     0.17
	  6 php                      0.07     0.15
	  2 glxinfo                  0.05     0.04
	  2 glxinfo:cs0              0.05     0.04
	  2 glxinfo:disk$0           0.05     0.03
	  2 glxinfo:sh0              0.05     0.03
	  2 glxinfo:shlo0            0.05     0.03
	  2 llvmpipe-0               0.04     0.09
	  2 llvmpipe-1               0.04     0.09
	  2 llvmpipe-10              0.04     0.09
	  2 llvmpipe-11              0.04     0.09
	  2 llvmpipe-12              0.04     0.09
	  2 llvmpipe-13              0.04     0.09
	  2 llvmpipe-14              0.04     0.09
	  2 llvmpipe-15              0.04     0.09
	  2 llvmpipe-2               0.04     0.09
	  2 llvmpipe-3               0.04     0.09
	  2 llvmpipe-5               0.04     0.09
	  2 llvmpipe-6               0.04     0.09
	  2 llvmpipe-7               0.04     0.09
	  2 llvmpipe-8               0.04     0.09
	  2 llvmpipe-9               0.04     0.09
	  2 llvmpipe-4               0.04     0.08
	  6 clang                    0.03     0.09
	  3 rocminfo                 0.00     0.03
	  1 lspci                    0.00     0.02
	  1 ps                       0.00     0.01
	 82 sh                       0.00     0.00
	 13 gcc                      0.00     0.00
	 12 gsettings                0.00     0.00
	 12 himeno                   0.00     0.00
	  8 stat                     0.00     0.00
	  8 systemd-detect-          0.00     0.00
	  6 llvm-link                0.00     0.00
	  5 phoronix-test-s          0.00     0.00
	  2 cc                       0.00     0.00
	  2 dconf worker             0.00     0.00
	  2 gmain                    0.00     0.00
	  2 lscpu                    0.00     0.00
	  2 uname                    0.00     0.00
	  2 which                    0.00     0.00
	  2 xset                     0.00     0.00
	  1 date                     0.00     0.00
	  1 dirname                  0.00     0.00
	  1 dmesg                    0.00     0.00
	  1 dmidecode                0.00     0.00
	  1 grep                     0.00     0.00
	  1 ifconfig                 0.00     0.00
	  1 ip                       0.00     0.00
	  1 lsmod                    0.00     0.00
	  1 mktemp                   0.00     0.00
	  1 qdbus                    0.00     0.00
	  1 readlink                 0.00     0.00
	  1 realpath                 0.00     0.00
	  1 sed                      0.00     0.00
	  1 sort                     0.00     0.00
	  1 stty                     0.00     0.00
	  1 systemctl                0.00     0.00
	  1 template.sh              0.00     0.00
	  1 wc                       0.00     0.00
	  1 xrandr                   0.00     0.00
0 processes running
47 maximum processes
Code sizes for the application are small
mev@augusta:~/.phoronix-test-suite/installed-tests/pts/himeno-1.3.0$ size himenobmtxpa
   text	   data	    bss	    dec	    hex	filename
   8399	    676	    240	   9315	   2463	himenobmtxpa
Essentially repeated calls to the following single Jacobi function. Probably also a good case for -O3 vectorization options.
float
jacobi(int nn, Matrix* a,Matrix* b,Matrix* c,
       Matrix* p,Matrix* bnd,Matrix* wrk1,Matrix* wrk2)
{
  int    i,j,k,n,imax,jmax,kmax;
  float  gosa,s0,ss;

  imax= p->mrows-1;
  jmax= p->mcols-1;
  kmax= p->mdeps-1;

  for(n=0 ; n<nn ; n++){
    gosa = 0.0;


    for(i=1 ; i<imax; i++)
      for(j=1 ; j<jmax ; j++)
        for(k=1 ; k<kmax ; k++){
            s0= a->m[0][i][j][k]*p->m[0][i+1][j][k]
            + a->m[1][i][j][k]*p->m[0][i][j+1][k]
            + a->m[2][i][j][k]*p->m[0][i][j][k+1]
            + b->m[0][i][j][k]
             *( p->m[0][i+1][j+1][k] - p->m[0][i+1][j-1][k]
              - p->m[0][i-1][j+1][k] + p->m[0][i-1][j-1][k] )
            + b->m[1][i][j][k]
             *( p->m[0][i][j+1][k+1] - p->m[0][i][j-1][k+1]
              - p->m[0][i][j+1][k-1] + p->m[0][i][j-1][k-1] )
            + b->m[2][i][j][k]
             *( p->m[0][i+1][j][k+1] - p->m[0][i-1][j][k+1]
              - p->m[0][i+1][j][k-1] + p->m[0][i-1][j][k-1] )
            + c->m[0][i][j][k] * p->m[0][i-1][j][ k]
            + c->m[1][i][j][k] * p->m[0][i][j-1][k]
            + c->m[2][i][j][k] * p->m[0][i][j][k-1]
            + wrk1->m[0][i][j][k];

          ss= (s0*a->m[3][i][j][k] - p->m[0][i][j][k])*bnd->m[0][i][j][k];


          gosa+= ss*ss;
          wrk2->m[0][i][j][k]= p->m[0][i][j][k] + omega*ss;
        }

    for(i=1 ; i<imax ; i++)
      for(j=1 ; j<jmax ; j++)
        for(k=1 ; k<kmax ; k++)
          p->m[0][i][j][k]= wrk2->m[0][i][j][k];

  } /* end n loop */

  return(gosa);
}
Computation is repeated runs of this application
      1175981) himeno           cpu=14 start=8.11  finish=49.58
        1175982) himenobmtxpa     cpu=7 start=8.11  finish=49.58
      1175985) himeno           cpu=14 start=53.59 finish=95.91
        1175986) himenobmtxpa     cpu=15 start=53.59 finish=95.91
      1175987) himeno           cpu=6 start=99.91 finish=142.20
        1175988) himenobmtxpa     cpu=15 start=99.92 finish=142.20
      1175989) himeno           cpu=14 start=146.21 finish=188.63
        1175990) himenobmtxpa     cpu=7 start=146.21 finish=188.63
      1175992) himeno           cpu=6 start=192.63 finish=235.00
        1175993) himenobmtxpa     cpu=15 start=192.63 finish=235.00
      1175994) himeno           cpu=6 start=239.01 finish=281.36
        1175995) himenobmtxpa     cpu=15 start=239.01 finish=281.35
      1175998) himeno           cpu=6 start=285.36 finish=327.68
        1175999) himenobmtxpa     cpu=15 start=285.36 finish=327.68
      1176001) himeno           cpu=11 start=331.68 finish=373.93
        1176002) himenobmtxpa     cpu=12 start=331.69 finish=373.93
      1176003) himeno           cpu=3 start=377.94 finish=420.20
        1176004) himenobmtxpa     cpu=12 start=377.94 finish=420.20
      1176005) himeno           cpu=11 start=424.21 finish=466.42
        1176006) himenobmtxpa     cpu=4 start=424.21 finish=466.42
      1176010) himeno           cpu=11 start=470.43 finish=512.50
        1176011) himenobmtxpa     cpu=4 start=470.43 finish=512.50
      1176020) himeno           cpu=11 start=516.50 finish=558.76
        1176021) himenobmtxpa     cpu=12 start=516.51 finish=558.76